Touch Wide Slide Template for Market Analysis with Vertical Column Chart
RJ0200008_12
- Last Update 03/30/2025
- File Size 3.3MB
- # of Slides 2
- File Format PPTX
- Slide Ratio 16:9
- Color
Keywords
- #Content-Based Slides
- #Design-Based Slides
- #Business Strategy
- #Market and Competitor Analysis
- #Graph
- #Achievements
- #Competitor Analysis
- #Market Analysis
- #Column
- #Column Chart
- #16:9
- #vertical column chart PowerPoint
- #bar chart slide template
- #data comparison graph
- #market analysis chart
- #PowerPoint graph slide design
About the Product
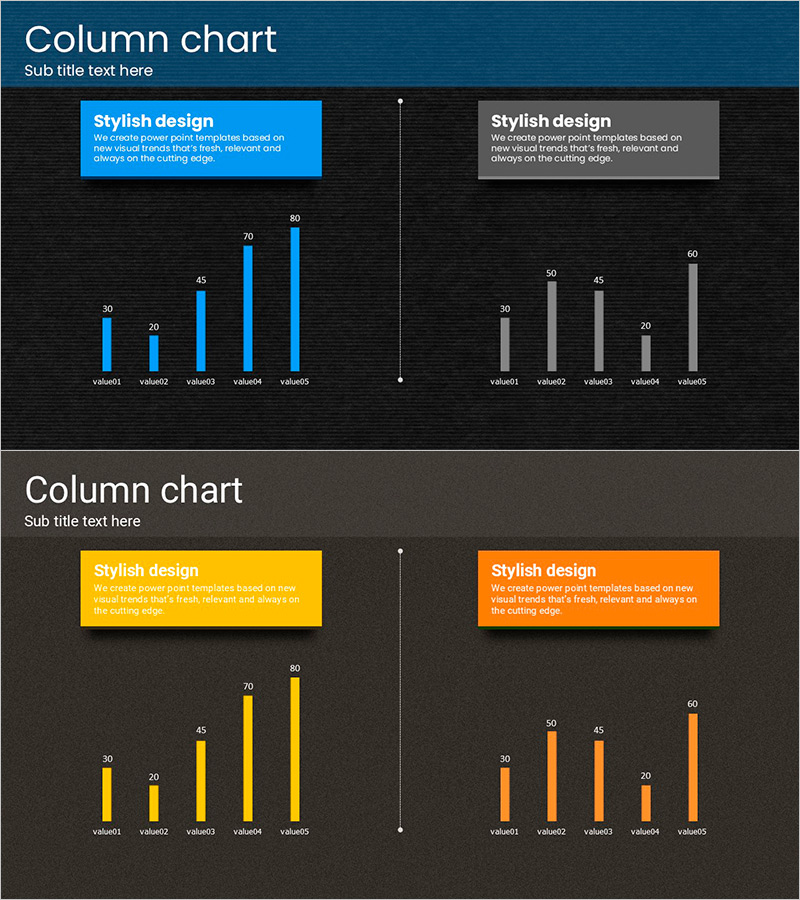
A vertical column chart PowerPoint slide designed for market analysis and competitive comparison. The template features five data bars displayed side-by-side on a dark background, with blue and gray color schemes to represent different data series or comparison groups. Each bar is labeled with numerical values at the top for precise data communication. The 16:9 widescreen format includes two slide variations—one with blue columns and one with gray columns—allowing you to select the color scheme that best fits your presentation context. Text box areas at the top enable you to add chart titles and descriptive captions. Fully editable PPTX format for immediate customization.
Usage Points
-
Main Usage
Visualize and compare five quantitative data points—such as market size, sales volume, market share, or performance metrics—using bar height as the primary visual indicator. Ideal for competitive benchmarking, quarterly performance reviews, product performance analysis, and any presentation requiring clear numerical comparison.
-
How to Use
Select one of the two slide variations (blue or gray color scheme) based on your presentation theme. Double-click on each column to edit the bar height and numerical labels. Update the title and description text boxes at the top to match your data context. Customize the legend and axis labels as needed for your specific analysis.
-
Recommended For
Marketing professionals presenting market research findings, sales teams reporting quarterly results, executives in strategy meetings, investor pitch decks, management consulting proposals, academic presentations, and business reports where quantitative data comparison is essential.
-
Slide Structure
Each slide contains a title text box at the top, five vertical columns in the center (blue or gray depending on the variation), and numerical value labels positioned above each bar. Dark background with white text ensures high contrast and readability. Two complete slide layouts provided with different color schemes.
Related Products
-

Airplane Bar Graph – Market Competition Analysis
#Market and Competitor Analysis #Graph #Competitor Analysis
-

Space Shuttle Graph for Data Visualization – Creativity and Innovation
#Market and Competitor Analysis #Graph #Competitor Analysis
-

Regional Analysis of Green Building Adoption - Business Strategy
#Business Strategy #Market and Competitor Analysis #Graph
-

Pie & Bar Analysis Graphs – Optimized for Market and Competitor Analysis
#Market and Competitor Analysis #Graph #Competitor Analysis
