Growing Demand for Organic Agricultural Products Bar Chart
RJ0600096_13
- Last Update 07/16/2025
- File Size 0.1MB
- # of Slides 2
- File Format PPTX
- Slide Ratio 16:9
- Color
Keywords
- #Content-Based Slides
- #Design-Based Slides
- #Business Strategy
- #Market and Competitor Analysis
- #Graph
- #Achievements
- #Competitive Advantage
- #Column
- #Column Chart
- #16:9
- #vertical bar chart PowerPoint
- #bar graph slide template
- #demand analysis chart
- #market data visualization
- #comparative analysis PPT slide
About the Product
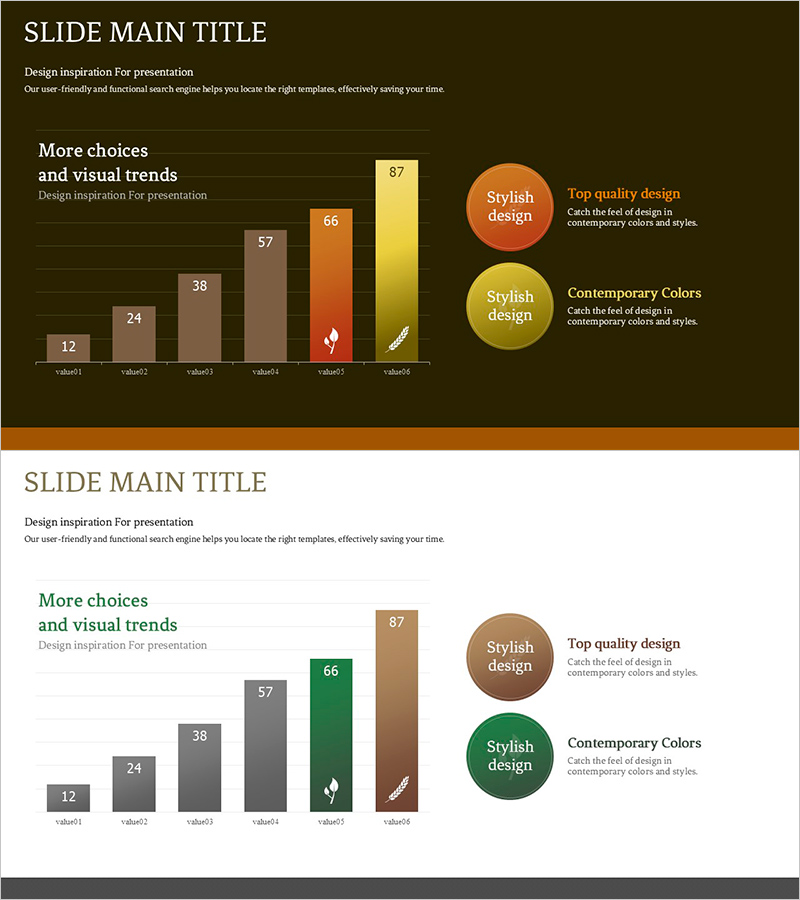
A vertical bar chart PowerPoint slide comparing the growing demand for organic agricultural products across 6 items with precise data visualization. The chart features a gradient color scheme in brown, orange, and yellow tones, with numerical labels (12, 24, 38, 57, 66, 87) positioned above each bar for accurate data comparison. Two circular badge elements on the right highlight key messages (Top quality design, Contemporary Colors), making it ideal for business strategy and market analysis presentations. Provided in 16:9 widescreen PPTX format for immediate use.
Usage Points
-
Main Usage
Enables comparative analysis of market demand trends in agricultural and food industries using data-driven visualization, effectively communicating organic market growth to executives and investors. The 6-item ascending trend is instantly comprehensible, making it highly effective for business strategy and marketing planning presentations.
-
How to Use
Replace the 6 item labels (value1–value6) and numerical values (12, 24, 38, 57, 66, 87) with your actual data. Bar heights and colors adjust automatically, and the right-side circular badge text can be customized to match your key messages. Simple editing using standard PowerPoint tools enables quick customization.
-
Recommended For
Ideal for agricultural and food company executive reports, investment pitch decks, marketing team market analysis presentations, consulting firm industry reports, and government agency policy briefings. Suitable for any business presentation requiring demand growth, growth rate, or market share comparisons.
-
Slide Structure
Two-slide layout: the first features a dark brown background with a 6-item vertical bar chart and two circular badges (orange and yellow) on the right as the main chart slide. The second slide presents the same graph structure on a light gray background for adaptability to different presentation environments. All elements are optimized for 16:9 widescreen format.
Related Products
-

Visually Enhanced Bar Graph by Promotional Product Performance
#Business Strategy #Market and Competitor Analysis #Graph
-

Data Comparison: Then vs. Now – Performance and Competitive Edge
#Business Strategy #Market and Competitor Analysis #Graph
-

Sports Vertical Bar Chart – The Perfect Choice for Performance Analysis
#Business Strategy #Market and Competitor Analysis #Graph
-

Data Analysis PPT for Households with Pets
#Business Strategy #Market and Competitor Analysis #Graph
