Doughnut Chart for Market Share Analysis – Visualizing Data at a Glance
RJ0400004_7
- Last Update 05/18/2025
- File Size 1.7MB
- # of Slides 2
- File Format PPTX
- Slide Ratio 16:9
- Color
Keywords
About the Product
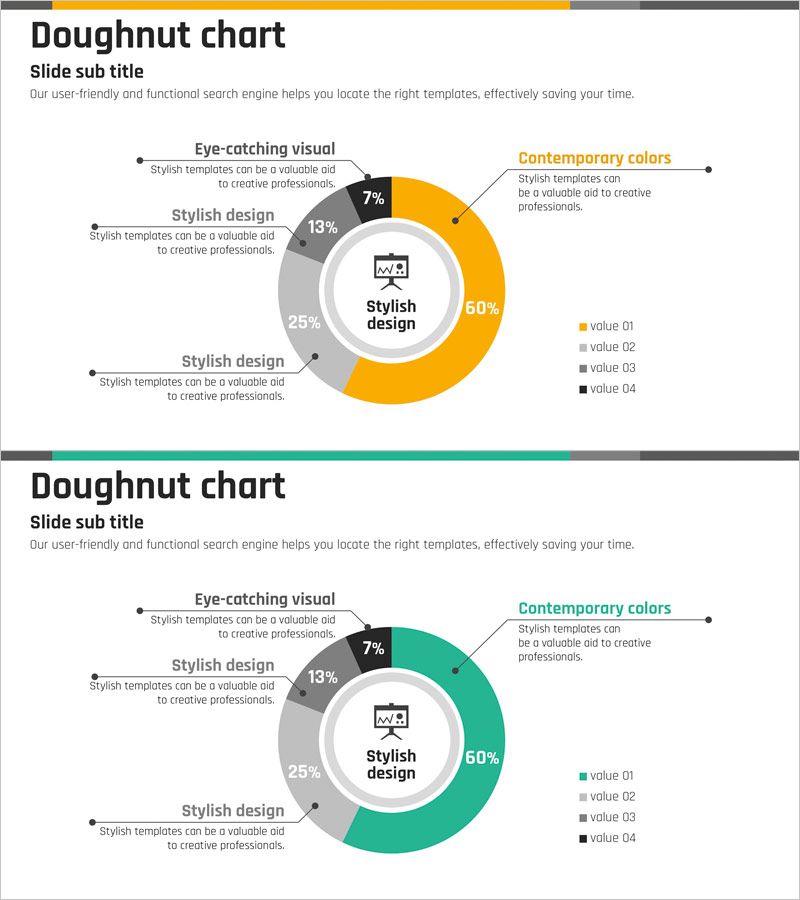
A professional doughnut chart PowerPoint slide designed to visualize proportional data such as market share, sales distribution, and customer composition. The template features two color variations: a vibrant yellow-and-teal combination and a neutral gray-tone version. Each slide includes a central icon area and external callout labels for clear data interpretation. The 16:9 widescreen format contains 2 fully editable slides, making it ideal for business presentations, market analysis reports, executive briefings, and strategic planning sessions.
Usage Points
-
Main Usage
Effectively communicates proportional relationships such as market share percentages, revenue distribution by segment, customer demographics, and budget allocation. The central icon area highlights key messaging while external labels provide detailed segment information for comprehensive data storytelling.
-
How to Use
Deploy in market analysis sections to compare competitive positioning, in financial reports to show revenue composition by business unit, or in strategic presentations to illustrate resource allocation. Simply replace the percentage values and labels to adapt the template to your specific dataset.
-
Recommended For
Marketing managers, business analysts, executives, management consultants, and financial professionals presenting market analysis, sales performance, customer segmentation, or budget distribution. Suitable for quarterly earnings reports, investor presentations, board meetings, and strategic planning workshops.
-
Slide Structure
Two-slide set featuring a 4-segment doughnut chart as the focal point. Each segment is color-coded using yellow, gray, teal, and black for visual distinction. The central circular area accommodates an icon and text label, while external callout boxes provide segment descriptions. The 16:9 layout ensures compatibility with modern presentation standards.
Related Products
-

World Map and Share Chart for Market Analysis – Effective Data Visualization
#Market and Competitor Analysis #Graph #Other
-

Soccer Match Analysis Chart – Performance Analysis and Future Forecast
#Business Vision and Strategy #Market and Competitor Analysis #Graph
-

Market Share Global Map – Real-Time Data for Market Analysis
#Market and Competitor Analysis #Graph #Market Share
-

Network Service Market Share Analysis with Doughnut Chart
#Market and Competitor Analysis #Graph #Market Share
