Rocket Research Progress Pie Chart – Market and Service Analysis
RJ0700010_8
- Last Update 07/24/2025
- File Size 0.6MB
- # of Slides 2
- File Format PPTX
- Slide Ratio 16:9
- Color
Keywords
- #Content-Based Slides
- #Design-Based Slides
- #Product/Service Introduction
- #Market and Competitor Analysis
- #Graph
- #Composition
- #Market Analysis
- #Circles
- #Doughnut Chart
- #16:9
- #donut pie chart PowerPoint
- #pie chart slide template
- #progress rate chart PPT
- #4-segment donut chart
- #ratio visualization PowerPoint
- #market analysis slide
About the Product
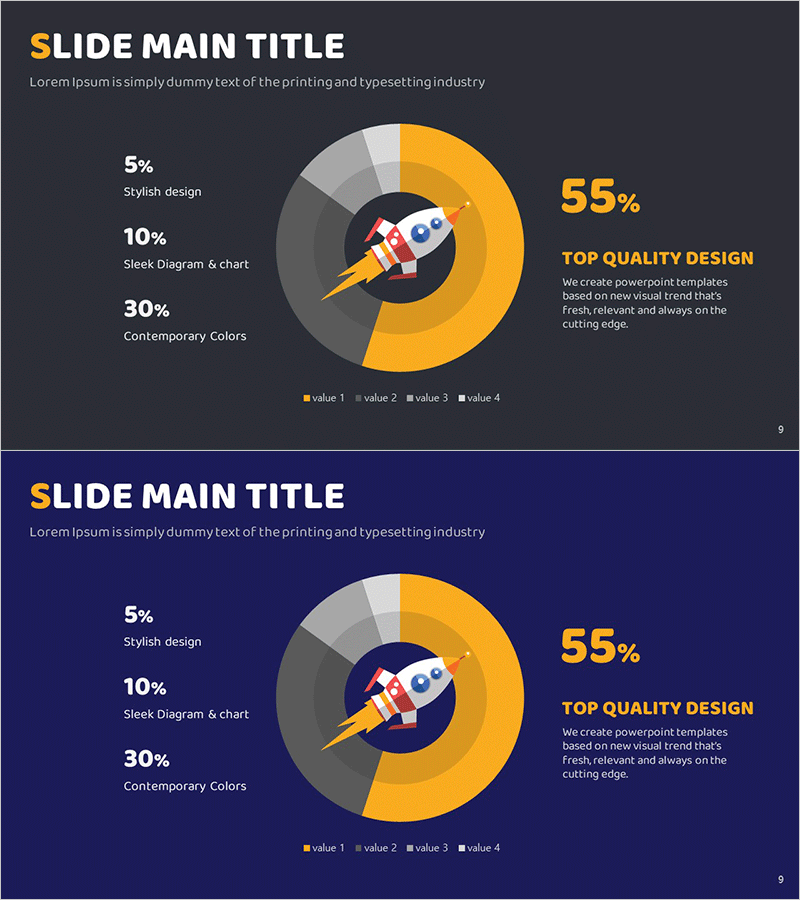
A PowerPoint slide combining a rocket icon with a donut-shaped pie chart for progress visualization. Set against a dark gray background, the donut chart is divided into 4 segments in gold, white, and gray tones, representing market analysis, service analysis, stylish design, and diagram elements. The 2-slide set provides identical layout variations optimized for 16:9 widescreen format. This presentation slide template is ready to use for business reports, competitive analysis, and project status updates.
Usage Points
-
Main Usage
The donut pie chart clearly expresses the proportion of each item relative to the whole. The rocket icon visually reinforces growth, progress, and innovation, while the 4-segment color differentiation allows intuitive category distinction. Ideal for communicating ratio-based data such as market share, service composition, and project progress.
-
How to Use
Replace the text labels (5%, 10%, 30%, 55%) with your actual data values and update the legend (value 1–4) with corresponding category names. Add key insights in the right text area to strengthen numerical interpretation. Both slides share the same structure, allowing side-by-side comparison of multiple datasets.
-
Recommended For
Recommended for marketing plans, business reports, investor pitch decks, competitive analysis documents, and product introduction presentations. Ideal for professionals (marketers, planners, executives, analysts) communicating ratio-based information such as market analysis, customer composition, revenue structure, and resource allocation.
-
Slide Structure
Donut pie chart with rocket icon centered, divided into 4 segments (5%, 10%, 30%, 55%). Left side displays item-specific values and labels; right side features a highlighted text area (55% TOP QUALITY DESIGN). Legend with 4 color indicators at bottom. 16:9 widescreen layout, 2 identical slides.
Related Products
-

Comparative Analysis of Composition Contents Pie Chart – Market and Competitor Analysis
#Product/Service Introduction #Market and Competitor Analysis #Graph
-

Science Experiment Analysis Circle Graph – Market and Service Introduction
#Product/Service Introduction #Market and Competitor Analysis #Graph
-

Health Checkup Data Analysis Circular Graph – Effective Business Data Visualization
#Product/Service Introduction #Market and Competitor Analysis #Diagram
-

Oriental Medicine Component Circle Graph – Accurate Visualization of Market and Products
#Product/Service Introduction #Market and Competitor Analysis #Graph
