Green & Gray Horizontal Bar Chart – Market Analysis and Competitive Edge
RJ0200067_17
- Last Update 04/18/2025
- File Size 0.6MB
- # of Slides 4
- File Format PPTX
- Slide Ratio 16:9
- Color
Keywords
- #Content-Based Slides
- #Design-Based Slides
- #Market and Competitor Analysis
- #Graph
- #Competitor Analysis
- #Competitive Advantage
- #Horizontal Bar
- #Horizontal Bar Chart
- #16:9
- #horizontal bar chart PowerPoint
- #bar graph slide template
- #competitor analysis chart
- #market analysis PowerPoint
- #data comparison visualization
- #how to create bar chart in PowerPoint
About the Product
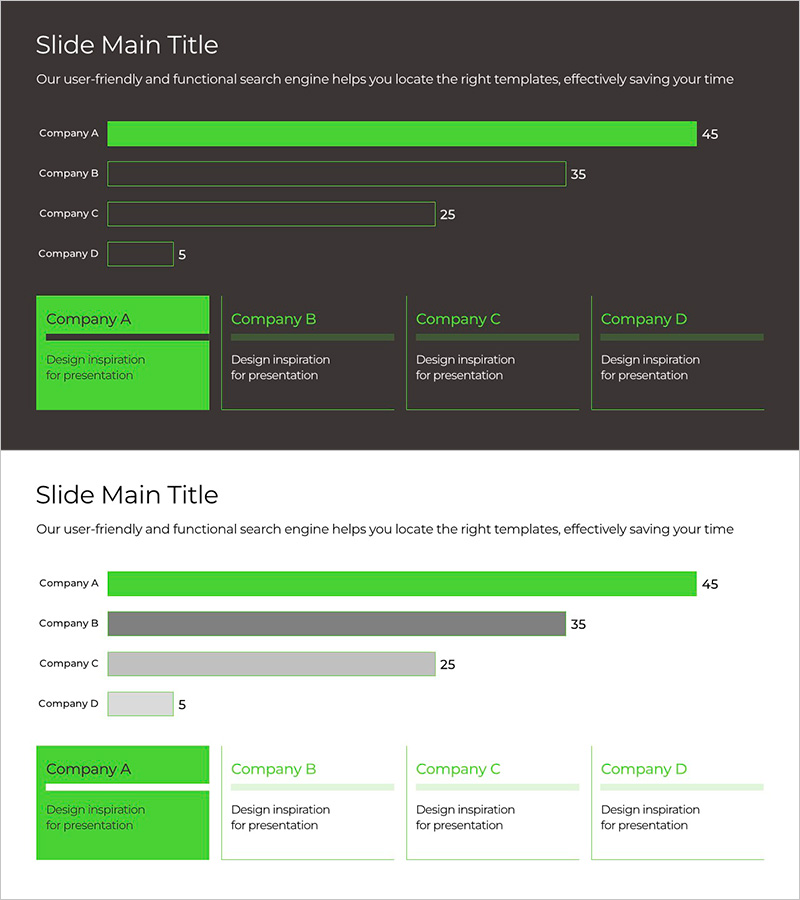
A 4-item horizontal bar chart PowerPoint slide designed for market analysis and competitive positioning. Bright green accent color contrasts with gray tones to highlight key metrics while maintaining visual balance. Each bar includes numeric labels, and the dual-layout structure combines a top bar graph with bottom card-style text boxes for comprehensive data presentation. Ideal for competitive benchmarking, market share analysis, performance metrics, and stakeholder reports—ready to customize and present immediately.
Usage Points
-
Main Usage
Display quantitative comparisons such as competitor performance, market share distribution, departmental metrics, or product rankings in a horizontal bar format that emphasizes relative size differences. Green highlighting draws attention to top performers or target achievements, while gray bars provide context for comparative analysis.
-
How to Use
Input numerical values into the top bar graph section and add descriptive text or insights in the bottom card areas. Apply green color to highlight primary metrics or winning positions, and use gray for comparative reference points. This layout supports sequential explanation during presentations and works well for detailed Q&A discussions.
-
Recommended For
Marketing and sales professionals presenting competitive analysis, executive reports requiring performance comparisons, investor pitch decks explaining market positioning, product strategy teams conducting benchmarking studies, and consulting firms delivering quantitative analysis sections.
-
Slide Structure
4-slide set: Slides 1–2 feature a top section with 4 horizontal bars (1 green, 3 gray) and a bottom section with 4 card-style text boxes. Slides 3–4 provide layout variations with fully editable colors, values, and labels. 16:9 widescreen format optimized for modern presentation environments.
Related Products
-

Red Blue Area Chart – Market and Competitor Analysis
#Market and Competitor Analysis #Graph #Competitor Analysis
-

Eco-friendly Eco Horizontal Bar Graph - Market Competition Analysis
#Market and Competitor Analysis #Graph #Competitor Analysis
-

Ticket Sales Graph – Visualizing Competitive Edge
#Market and Competitor Analysis #Graph #Competitor Analysis
-

Navy Orange Comparison Bar Graph
#Market and Competitor Analysis #Graph #Competitor Analysis
