Triangle Pattern Wide PowerPoint Template – Horizontal Bar Chart
RJ0200005_5
- Last Update 03/29/2025
- File Size 0.2MB
- # of Slides 2
- File Format PPTX
- Slide Ratio 16:9
- Color
Keywords
- #Content-Based Slides
- #Design-Based Slides
- #Market and Competitor Analysis
- #Graph
- #Competitor Analysis
- #Competitive Advantage
- #Horizontal Bar
- #Horizontal Bar Chart
- #16:9
- #horizontal bar chart PowerPoint
- #bar graph presentation slide
- #5-item comparison chart
- #data visualization PPT slide
- #how to create bar chart in PowerPoint
About the Product
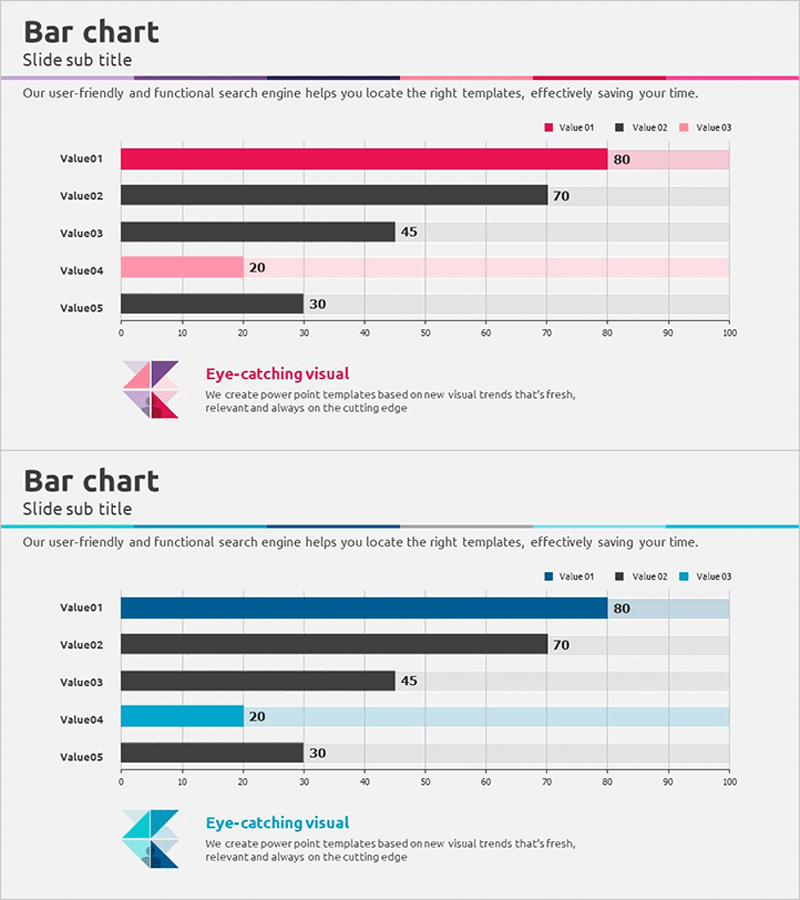
A PowerPoint slide featuring a horizontal bar chart comparing five data items with three color series (pink, black, and gray). Each bar displays precise numerical values (80, 70, 45, 20, 30) on a 0-100 scale axis, making data comparison intuitive and clear. The triangle pattern icon at the top serves as a visual accent element. This presentation template is ideal for competitive analysis, market share visualization, performance metrics, and analytical reports where multi-series data comparison is essential.
Usage Points
-
Main Usage
This slide visualizes numerical data comparison for five items using a horizontal bar chart format. Three color series (pink, black, gray) represent multiple data dimensions per item, enabling complex data analysis. The 0-100 scale axis allows viewers to instantly grasp relative magnitudes, while the triangle pattern icon provides visual emphasis and brand consistency.
-
How to Use
Deploy this slide in competitive benchmarking, market share analysis, departmental performance reviews, product feature comparisons, and customer satisfaction surveys. The color-coded bars and numerical labels facilitate quick audience comprehension during live presentations. Ideal for business proposals, analytical reports, and executive briefings where data-driven decision-making is central.
-
Recommended For
Marketing managers, sales directors, executives, management consultants, data analysts, and business strategists. Suitable for market analysis presentations, competitive positioning, performance evaluation reports, and business development proposals across industries.
-
Slide Structure
Two-slide set with identical 5-item horizontal bar chart structure. Slide 1 uses pink, black, and gray color series; Slide 2 applies blue, black, and gray alternatives. Both slides display values (80, 70, 45, 20, 30) at bar endpoints with a 0-100 horizontal axis. Triangle pattern icon and descriptive text maintain visual consistency across both layouts.
Related Products
-

Ticket Sales Graph – Visualizing Competitive Edge
#Market and Competitor Analysis #Graph #Competitor Analysis
-

Navy Orange Comparison Bar Graph
#Market and Competitor Analysis #Graph #Competitor Analysis
-

Optimizing Competitor Analysis with Horizontal Bar Graph – Visual Impact
#Market and Competitor Analysis #Graph #Competitor Analysis
-

Eco-friendly Eco Horizontal Bar Graph - Market Competition Analysis
#Market and Competitor Analysis #Graph #Competitor Analysis
