Green & Gray Template Wide Table – Visualizing Financial Plans and Performance
RJ0200067_14
- Last Update 04/18/2025
- File Size 0.5MB
- # of Slides 2
- File Format PPTX
- Slide Ratio 16:9
- Color
Keywords
- #Content-Based Slides
- #Design-Based Slides
- #Financial Plans and Performance
- #Diagram
- #Cash Flow Statement
- #Sales and Revenue
- #Table
- #Standard Table
- #16:9
- #table PowerPoint slide
- #financial data presentation
- #6-column template
- #budget vs actual slide
- #quarterly performance chart
- #wide table slide design
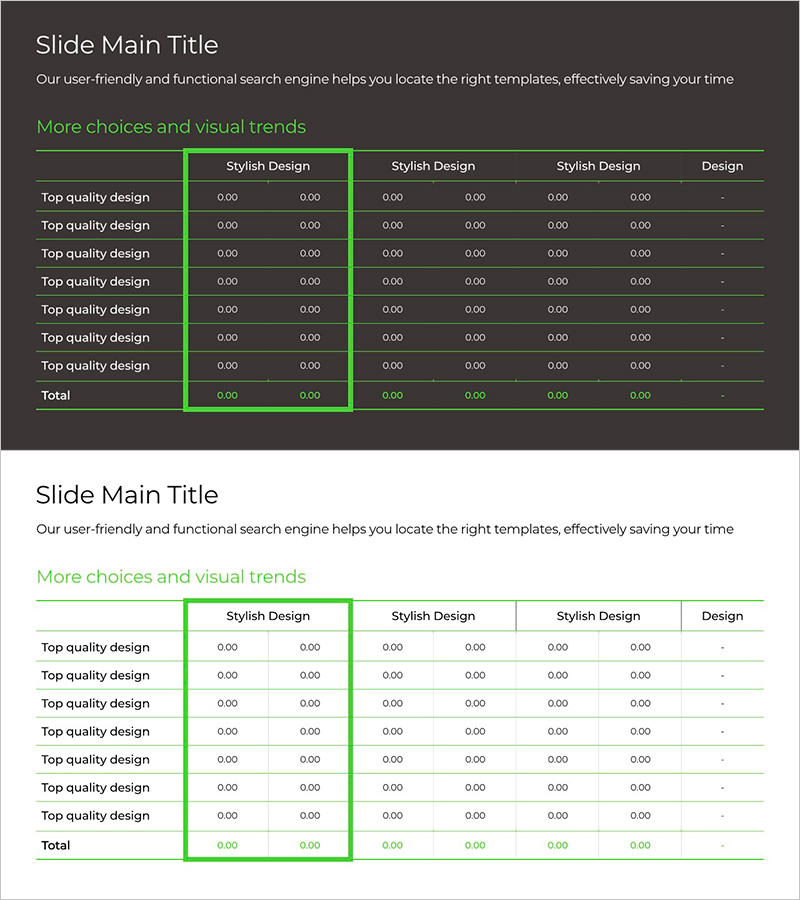
About the Product
A wide-format 6-column data table PowerPoint slide designed to compare and analyze financial plans against actual performance. The green and gray dual-tone color scheme emphasizes data credibility, while row dividers and header highlighting maximize information readability. The 2-slide set enables clear visualization of cash flow statements, budget vs. actual comparisons, and quarterly performance metrics. Optimized for 16:9 widescreen presentations, with fully editable cell merging and number formatting for seamless data integration.
Usage Points
-
Main Usage
Organize and compare financial metrics, budget allocations, quarterly results, and cash flow data in a structured row-and-column format. The header emphasis and row dividers create clear information hierarchy, enabling audiences to quickly grasp comparative data and performance trends.
-
How to Use
Insert into financial reports, business performance presentations, investor briefings, and executive dashboards. Simply enter numbers directly into cells or copy-paste data from Excel spreadsheets for instant integration. Colors and fonts are fully customizable to match corporate branding guidelines.
-
Recommended For
CFOs, financial analysts, business managers, consultants, and data-driven decision makers. Ideal for quarterly performance reviews, budget planning sessions, investor presentations, and executive reporting where numerical credibility is paramount.
-
Slide Structure
6-column × 7-row wide table with green header row on white text and gray row dividers for clear data separation. Two-slide layout: first slide for budget vs. actual comparison, second slide for quarterly trend analysis with consistent formatting throughout.
Related Products
-

Spring Background Table – Visualizing Financial Performance!
#Financial Plans and Performance #Diagram #Cash Flow Statement
-

Annual Sales and Profit Analysis Table – Key to Financial Planning
#Financial Plans and Performance #Diagram #Cash Flow Statement
-

Green Orange Table Slide – Financial Insights at a Glance
#Financial Plans and Performance #Diagram #Cash Flow Statement
-

Key Metrics – Effective Financial Analysis Slide
#Financial Plans and Performance #Diagram #Cash Flow Statement
