Key Metrics – Effective Financial Analysis Slide
RB0800012_14
- Last Update 03/19/2025
- File Size 3.8MB
- # of Slides 2
- File Format PPTX
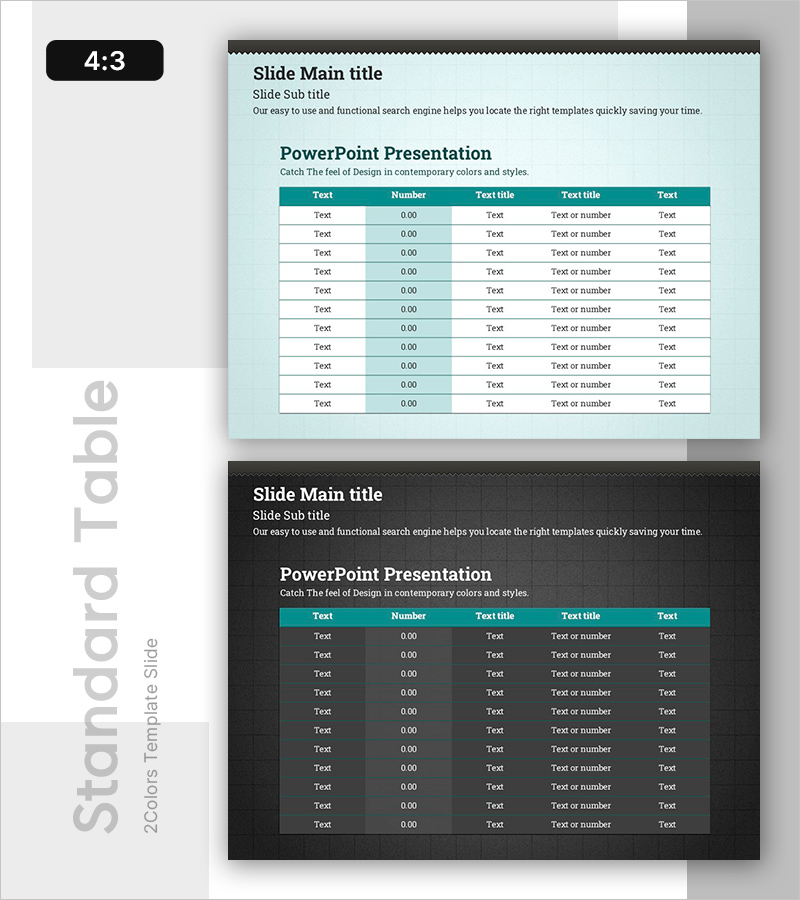
- Slide Ratio 4:3
- Color
Keywords
About the Product
A table-format PowerPoint slide optimized for financial analysis and key metrics comparison. The design features a light blue background with a teal header row, creating a professional two-tone color scheme that enhances data readability. The table contains 5 columns (Text, Number, Text title, Text title, Text) and 11 data rows, allowing you to systematically organize financial indicators such as revenue, profit, and cash flow. Each cell supports both text and numeric input, making this slide practical for presentations, financial reports, and investor communications.
Usage Points
-
Main Usage
Display key financial indicators (revenue, operating profit, net income, cash flow, ROI) in a structured table format for quarterly earnings presentations, investor briefings, and financial reports. The combination of numeric data and text descriptions enables clear communication of financial performance and decision-making rationale.
-
How to Use
Replace header labels ('Text', 'Number', 'Text title') with actual metric names (Revenue, Operating Income, Net Profit, etc.), then populate each cell with corresponding figures and descriptions. Keep the teal header to maintain visual hierarchy, and add or remove rows as needed to accommodate your data structure.
-
Recommended For
CFOs, finance managers, and executives presenting quarterly or annual financial results to board members, investors, and shareholders. Also suitable for marketing teams comparing campaign ROI and channel-specific revenue, or sales teams organizing customer and regional performance data.
-
Slide Structure
Light blue background slide with a single teal header row and 11 data rows forming a 5-column table. Cell text alignment varies by column: left-aligned for Text columns, center-aligned for Number column, and left-aligned for Text title columns. Header and data rows are evenly spaced for consistent visual balance.
Related Products
-

Spring Background Table – Visualizing Financial Performance!
#Financial Plans and Performance #Diagram #Cash Flow Statement
-

Green & Gray Template Wide Table – Visualizing Financial Plans and Performance
#Financial Plans and Performance #Diagram #Cash Flow Statement
-

Origami Presentation Template Section Table – Showcase Financial Performance
#Financial Plans and Performance #Diagram #Cash Flow Statement
-

Annual Sales and Profit Analysis Table – Key to Financial Planning
#Financial Plans and Performance #Diagram #Cash Flow Statement
