Annual Sales and Profit Analysis Table – Key to Financial Planning
RM0100004_32
- Last Update 01/25/2025
- File Size 3.4MB
- # of Slides 2
- File Format PPTX
- Slide Ratio 16:9
- Color
Keywords
About the Product
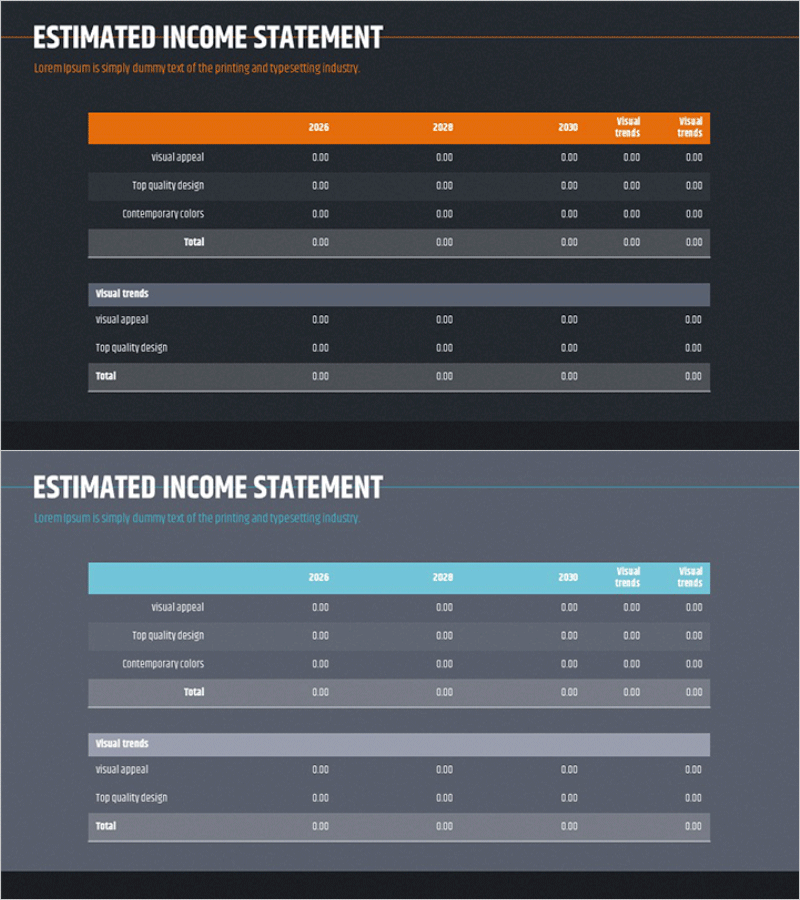
A comprehensive financial analysis table PowerPoint slide for comparing annual sales and profit performance across multiple years. The slide features a two-section layout with orange and gray header rows for clear visual distinction. The upper section displays visual appeal metrics, design quality indicators, and contemporary color analysis across five fiscal years (2026–2030) plus visual trends columns. The lower section presents additional visual trends data in a complementary table format. Each cell is editable for entering actual financial figures, revenue percentages, and growth projections. Delivered as a 16:9 widescreen 2-slide deck, this template integrates seamlessly into financial planning presentations, business reports, and investor pitch decks.
Usage Points
-
Main Usage
Designed to visualize financial performance and year-over-year revenue trends with clarity and impact. Organizes critical financial metrics—revenue, profit margins, growth rates—in a structured table format that enhances stakeholder comprehension. Effectively communicates financial health and growth potential to investors, executives, and board members.
-
How to Use
Enter visual appeal scores and design quality metrics in the orange header section. Input actual sales and profit figures in the gray data rows for each fiscal year (2026–2030). Use the visual trends columns to project future performance or highlight growth rates. Customize cell background colors and fonts to match your corporate brand identity.
-
Recommended For
CFOs, financial analysts, business planning teams, investor relations managers, and corporate development professionals. Ideal for quarterly and annual financial reports, business plan financial sections, investor presentations, executive briefings, and bank loan applications.
-
Slide Structure
Two-section layout with 3-row structure. Upper section: 3 metric rows (visual appeal, top quality design, contemporary colors) × 7 columns (5 fiscal years 2026–2030 + 2 visual trends columns). Lower section: 3 metric rows × 4 columns. Total configuration: main table 5 rows × 7 columns + supplementary table 3 rows × 4 columns.
Related Products
-

Key Metrics – Effective Financial Analysis Slide
#Financial Plans and Performance #Diagram #Cash Flow Statement
-

Green & Gray Template Wide Table – Visualizing Financial Plans and Performance
#Financial Plans and Performance #Diagram #Cash Flow Statement
-

Spring Background Table – Visualizing Financial Performance!
#Financial Plans and Performance #Diagram #Cash Flow Statement
-

Green Orange Table Slide – Financial Insights at a Glance
#Financial Plans and Performance #Diagram #Cash Flow Statement
