Analyzing Market Share with Donut Chart – Clean and Stylish Design
RJ0600059_6
- Last Update 07/06/2025
- File Size 3.6MB
- # of Slides 2
- File Format PPTX
- Slide Ratio 16:9
- Color
Keywords
- #Content-Based Slides
- #Design-Based Slides
- #Company Introduction
- #Market and Competitor Analysis
- #Graph
- #Key Achievements
- #Market Share
- #Circles
- #Doughnut Chart
- #16:9
- #donut chart PowerPoint
- #pie chart slide template
- #data visualization presentation
- #market share chart
- #donut graph template
- #proportional data PPT slide
About the Product
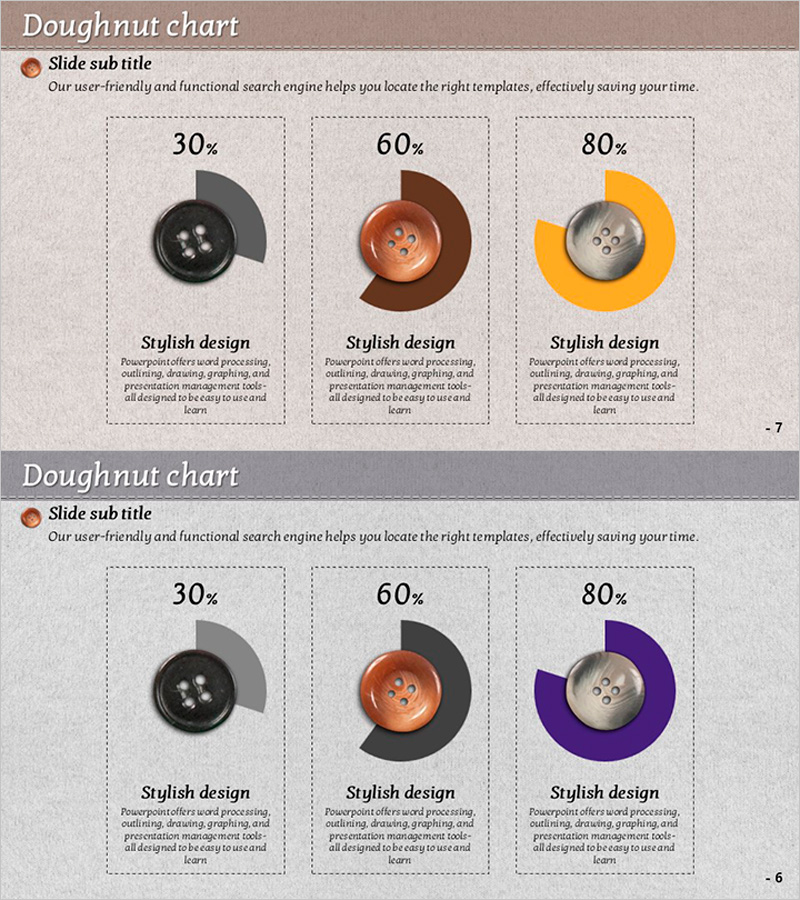
A professional donut chart PowerPoint slide set designed to visualize proportional data such as market share, sales distribution, and customer composition. This 2-slide template features three color variations—black, brown, and orange—each displaying three data points (30%, 60%, 80%) in donut format. The circular button-like center element combined with the arc-shaped outer ring creates clear data comparison and includes ample text description areas for immediate presentation use. Provided in 16:9 widescreen PPTX format, fully editable in all PowerPoint versions.
Usage Points
-
Main Usage
Effectively communicate proportional relationships such as market share, sales breakdown, customer demographics, and budget allocation. The donut center element allows emphasis of key metrics or additional information, providing superior information delivery compared to standard pie charts.
-
How to Use
Insert into company overview, business status, marketing analysis, or financial report sections. Customize the percentage values and colors to match your data, then populate the text description areas with your analysis content.
-
Recommended For
Ideal for executive presentations, investor pitches, marketing strategy sessions, and business performance reviews. Recommended for professionals including executives, data analysts, marketing managers, and finance officers.
-
Slide Structure
Both slides follow identical layout: title area at top + three donut charts in center (displaying 30%, 60%, 80% data respectively) + text description box at bottom. Each chart comprises an arc-shaped outer ring and circular center element, with color differentiation in black, brown, and orange tones.
Related Products
-

Performance Achievement Status Illustrated with Doughnut Chart Slide
#Company Introduction #Market and Competitor Analysis #Graph
-

Visualizing Physical Championship Winning Status with Doughnut Chart
#Company Introduction #Market and Competitor Analysis #Graph
-

Safety Template Donut Chart – Visualizing Performance and Management
#Company Introduction #Market and Competitor Analysis #Graph
-

Rhombus Doughnut Chart PowerPoint Template – Performance and Market Share Analysis
#Company Introduction #Market and Competitor Analysis #Graph
