Visualizing Physical Championship Winning Status with Doughnut Chart
RJ0800015_5
- Last Update 08/04/2025
- File Size 0.8MB
- # of Slides 2
- File Format PPTX
- Slide Ratio 16:9
- Color
Keywords
- #Content-Based Slides
- #Design-Based Slides
- #Company Introduction
- #Market and Competitor Analysis
- #Graph
- #Other
- #Key Achievements
- #Market Share
- #Circles
- #Doughnut Chart
- #16:9
- #doughnut chart PowerPoint
- #pie chart slide template
- #ratio visualization PPT
- #donut chart presentation
- #4-segment graph slide
- #performance data visualization
- #PowerPoint chart download
About the Product
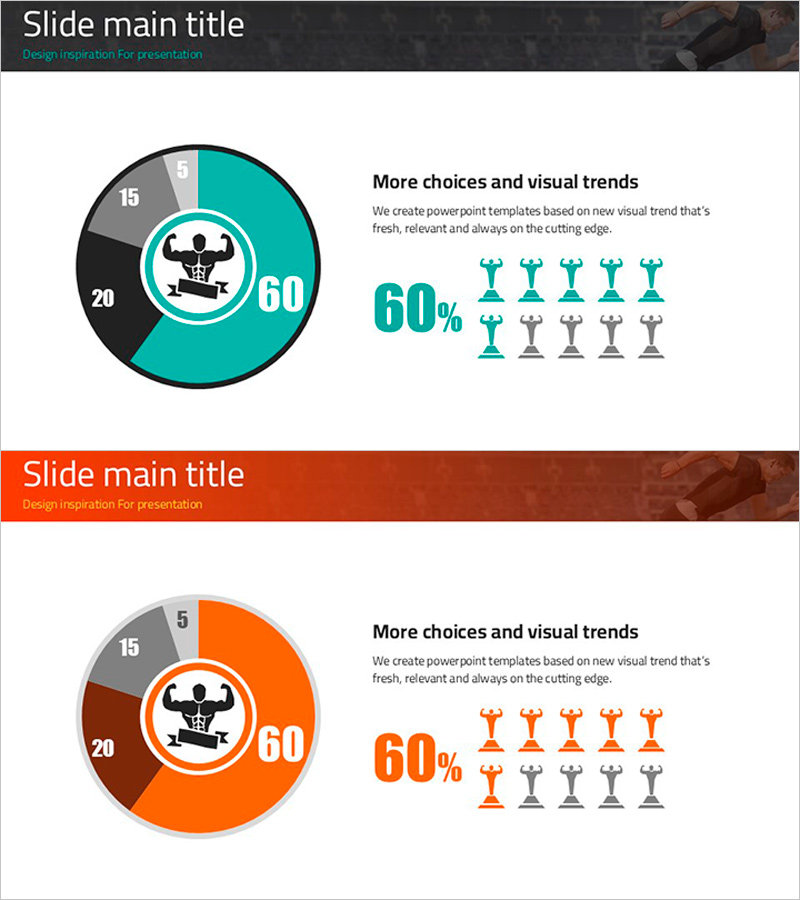
A doughnut chart PowerPoint slide designed to visualize ratio data such as physical championship winning status, market share, and key performance metrics. This 2-slide set features teal and orange color schemes with a central icon surrounded by a 4-segment circular chart. Each slide is formatted in 16:9 widescreen ratio for modern presentation environments, with numeric labels and legend icons that clearly communicate data meaning. Provided in fully editable PPTX format, allowing you to customize values, text, and colors to match your specific data and branding requirements.
Usage Points
-
Main Usage
Visualize ratio data, market share, winning status, and performance distribution using a circular chart format that enables audiences to instantly grasp relative proportions. The central icon emphasizes the topic, while color-coded segments clearly represent each item's relative size.
-
How to Use
Open the slide and replace numeric values and labels with your own data. The central icon can be swapped to match your topic, and the color palette can be adjusted to align with corporate branding. Suitable for presentations, reports, business plans, and strategic documents.
-
Recommended For
Marketing managers, sales directors, project leaders, and executives presenting performance analysis, market conditions, customer distribution, and budget allocation. Ideal for presentations emphasizing ratio-based data and comparative metrics.
-
Slide Structure
2-slide composition with a central circular icon surrounded by a 4-segment doughnut chart on each slide. The first slide uses teal color tones while the second employs orange tones, enabling diverse data representation through color variation. Each segment includes numeric labels and legend icons for clear data identification.
Related Products
-

Green Orange Market Share Visualization – Data-Driven Insights
#Market and Competitor Analysis #Graph #Other
-

Urban Construction Work Donut Chart – Market Share Analysis
#Market and Competitor Analysis #Graph #Other
-

Donut Chart and Mobile Mockup – Market Share Analysis
#Business Strategy #Market and Competitor Analysis #Graph
-

Visualizing South Korea's Market Share – Data-Driven Insights
#Company Introduction #Market and Competitor Analysis #Graph
