Doughnut Chart for Market Share Analysis – Performance and Trends
RJ0600068_6
- Last Update 07/08/2025
- File Size 4.3MB
- # of Slides 2
- File Format PPTX
- Slide Ratio 16:9
- Color
Keywords
- #Content-Based Slides
- #Design-Based Slides
- #Company Introduction
- #Market and Competitor Analysis
- #Graph
- #Key Achievements
- #Market Share
- #Circles
- #Doughnut Chart
- #16:9
- #doughnut chart PowerPoint
- #pie chart slide template
- #ratio comparison chart
- #market share visualization
- #percentage chart PowerPoint
- #data visualization slides
About the Product
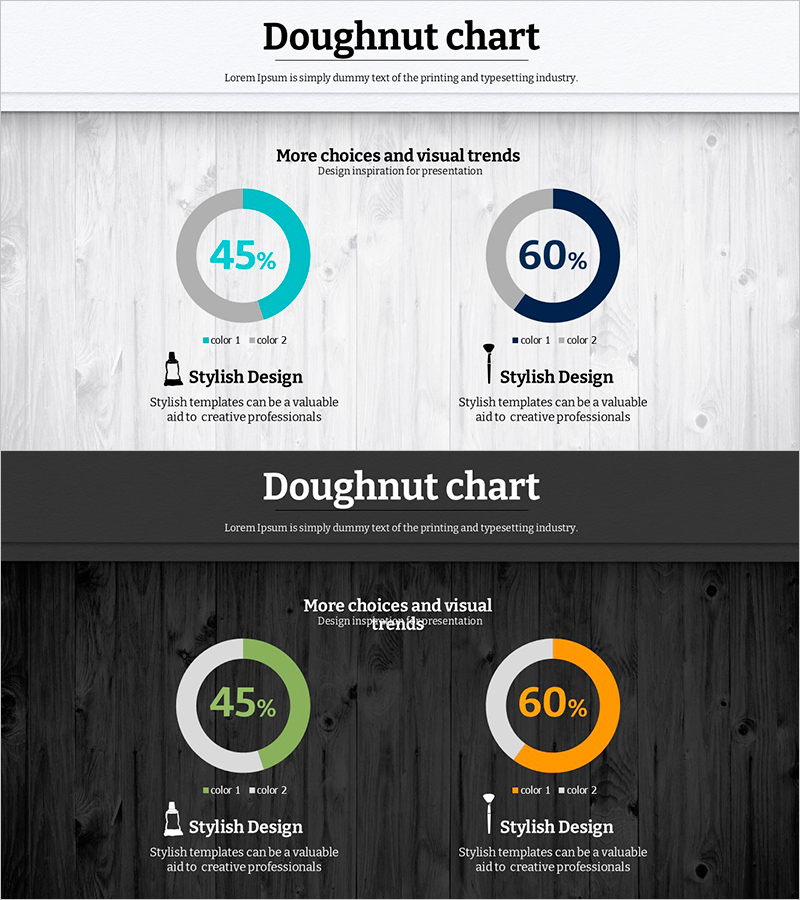
A professional doughnut chart PowerPoint slide designed for market share analysis and performance visualization. This 2-slide template features dual-color combinations including teal, navy, green, and orange on both light wood-tone and dark backgrounds. Each doughnut chart displays percentage values at the center with color-coded legends below for clear data differentiation. The slides are ready to use in business presentations, quarterly reports, and executive dashboards. Format: 16:9 widescreen PPTX.
Usage Points
-
Main Usage
Effectively visualize part-to-whole relationships such as market share distribution, sales composition, and segment breakdown. The centered percentage value emphasizes key data, while color-coded legends enable quick audience comprehension of each category.
-
How to Use
Ideal for business presentations, quarterly earnings reports, and marketing analysis decks where you need to compare competitor market share, product revenue mix, or customer segment distribution. Choose between light or dark background versions depending on your presentation environment and corporate branding.
-
Recommended For
Financial analysts, marketing managers, business executives, management consultants, and data scientists presenting quantitative ratio data. Particularly effective when comparing two metrics side-by-side or showing overall composition breakdown to stakeholders.
-
Slide Structure
Two-slide layout with dual doughnut charts per slide. Left chart uses teal and gray; right chart features navy and gray (light background) or green, gray, orange, and gray (dark background). Each chart displays centered percentage values (45%, 60%, etc.) with legends and descriptive text positioned below for context.
Related Products
-

Visualizing Physical Championship Winning Status with Doughnut Chart
#Company Introduction #Market and Competitor Analysis #Graph
-

Rhombus Doughnut Chart PowerPoint Template – Performance and Market Share Analysis
#Company Introduction #Market and Competitor Analysis #Graph
-

Safety Template Donut Chart – Visualizing Performance and Management
#Company Introduction #Market and Competitor Analysis #Graph
-

Red Sky Donut Chart – Market Share Analysis
#Company Introduction #Market and Competitor Analysis #Graph
