Rainbow Presentation Template Doughnut Chart – Start Your Unique Analysis
RJ0200022_9
- Last Update 04/03/2025
- File Size 3.8MB
- # of Slides 2
- File Format PPTX
- Slide Ratio 16:9
- Color
Keywords
- #Content-Based Slides
- #Design-Based Slides
- #Company Introduction
- #Market and Competitor Analysis
- #Graph
- #Key Achievements
- #Market Share
- #Circles
- #Doughnut Chart
- #16:9
- #doughnut chart PowerPoint
- #donut chart slide template
- #ratio visualization graph
- #market share presentation
- #data analysis PPT slide
About the Product
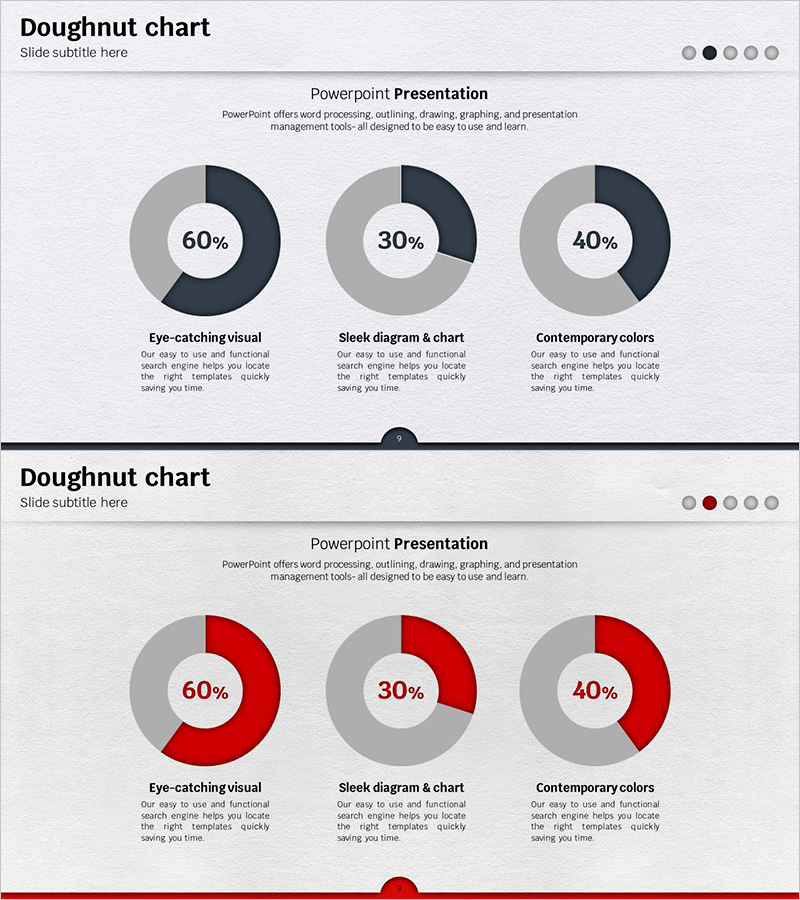
A professional doughnut chart PowerPoint slide template designed for market share, performance metrics, and analytical presentations. This 2-slide set features two color variations: navy-gray and red-gray combinations, with three doughnut charts per slide arranged horizontally for simultaneous data comparison. Each chart displays percentage values in the center white circle, with descriptive text areas below for context. The 16:9 widescreen format ensures compatibility with modern presentation environments, and the fully editable PPTX format allows instant customization of data, colors, and labels.
Usage Points
-
Main Usage
Visualize proportional data such as market share, sales distribution, customer demographics, and budget allocation. The centered percentage display emphasizes key metrics, while the three-chart layout enables side-by-side comparison of multiple data sets in analytical reports.
-
How to Use
Enter percentage values (60%, 30%, 40%, etc.) in the center circle of each doughnut chart. Add item names and descriptions in the text areas below. Select the color version matching your presentation theme, and freely edit chart colors and numerical values as needed.
-
Recommended For
Marketing professionals presenting market analysis, finance teams reporting budget status, sales teams analyzing performance metrics, executives presenting quarterly results, and consulting firms preparing client proposals. Suitable for any data-driven business presentation requiring proportional visualization.
-
Slide Structure
2-slide set with 3 doughnut charts per slide arranged horizontally. Each chart consists of a center white circle (for percentage input) and outer donut ring (for ratio representation). Text areas below each chart accommodate item labels and explanatory content.
Related Products
-

Market Share Donut Pie Chart – Visualization of Data Analysis
#Company Introduction #Market and Competitor Analysis #Diagram
-

Doughnut Chart for Market Share Analysis – Performance and Trends
#Company Introduction #Market and Competitor Analysis #Graph
-

Performance Achievement Status Illustrated with Doughnut Chart Slide
#Company Introduction #Market and Competitor Analysis #Graph
-

Blue Line Wide Template Donut Chart – Performance Analysis
#Company Introduction #Market and Competitor Analysis #Graph
