Minimal Block Table for Revenue and Profit Analysis – Emphasizing Financial Performance
RJ0600091_7
- Last Update 07/15/2025
- File Size 0MB
- # of Slides 2
- File Format PPTX
- Slide Ratio 16:9
- Color
Keywords
- #Content-Based Slides
- #Design-Based Slides
- #Financial Plans and Performance
- #Diagram
- #Sales and Revenue
- #Key Financial Indicators
- #Table
- #Standard Table
- #16:9
- #table PowerPoint slide
- #financial data presentation
- #horizontal table template
- #revenue analysis slide
- #financial performance chart
- #data comparison PPT
About the Product
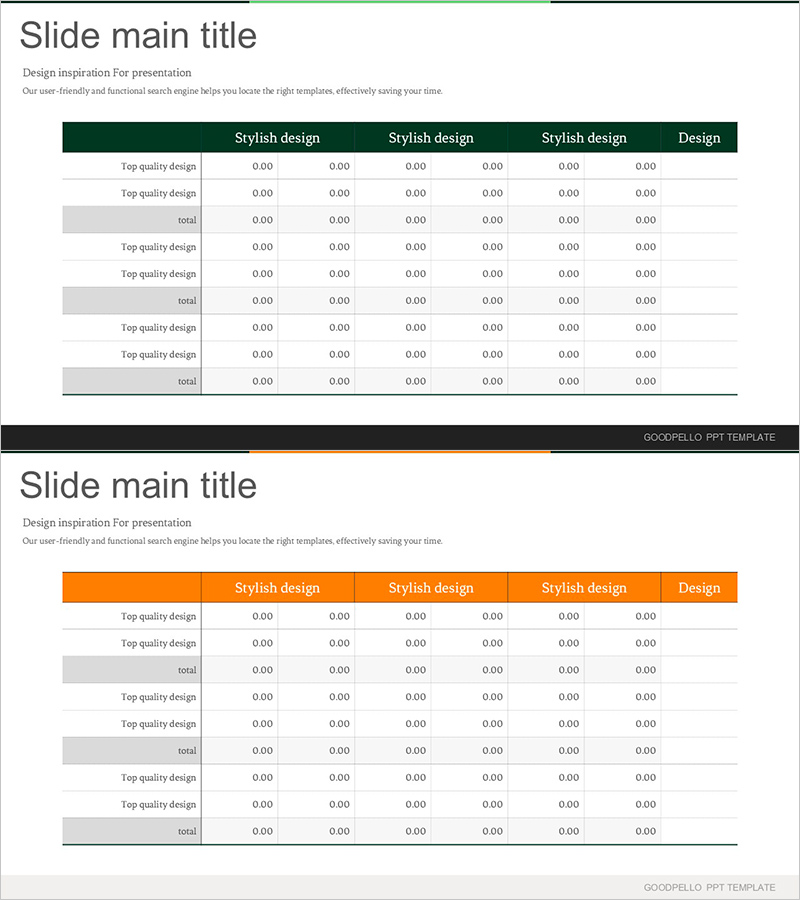
A horizontal block table PowerPoint slide designed for financial performance analysis. The data table features a dark green header and light gray rows, enabling clear comparison of six key metrics such as revenue, profit, and expenses. The 2-slide set includes identical table structures in two color schemes—dark green and orange—providing visual variety for your presentation. Each cell is easy to populate with numerical data, making it immediately applicable to financial reports, quarterly earnings presentations, investor meetings, and performance reviews. Optimized for 16:9 widescreen format to fit modern presentation environments.
Usage Points
-
Main Usage
Visualize financial performance metrics (revenue, profit, expenses, profit margin) in a structured table format to provide clear data comparison for executives and investors. Enables quick understanding of quarterly or annual performance trends at a glance.
-
How to Use
Use in the financial performance section of annual reports, quarterly earnings presentations, investor relations (IR) materials, and executive briefing decks. Simply input actual figures into each cell to create a complete presentation-ready slide.
-
Recommended For
CFOs, finance managers, executives, investor relations teams, consultants, and planning departments who regularly present financial data. Particularly effective when emphasizing quantitative performance metrics and comparative analysis.
-
Slide Structure
2-slide set. Each slide contains a 6-column (item name + 5 data columns) × 8-row (header + 7 data rows) table. The first slide features a dark green header, while the second uses an orange header, allowing flexible selection based on presentation flow and design preferences.
Related Products
-

Line PPT Table (Green & Orange) – Visualizing Financial Performance Data
#Financial Plans and Performance #Diagram #Sales and Revenue
-

Sales and Profit Table – Statistical Financial Performance
#Financial Plans and Performance #Diagram #Sales and Revenue
-

Logistics Factor Comparison Table – Intuitive Data Analysis
#Financial Plans and Performance #Diagram #Sales and Revenue
-

Orange Hexagon Presentation Template Table – Visualization of Revenue and Profit
#Financial Plans and Performance #Diagram #Sales and Revenue
