Doughnut Chart Slide for Dynamic Data Presentation – Vision of Achievement
RJ0200065_22
- Last Update 04/17/2025
- File Size 0.2MB
- # of Slides 2
- File Format PPTX
- Slide Ratio 16:9
- Color
Keywords
- #Content-Based Slides
- #Design-Based Slides
- #Company Introduction
- #Product/Service Introduction
- #Graph
- #Key Achievements
- #Development Status
- #Circles
- #Doughnut Chart
- #16:9
- #doughnut chart PowerPoint
- #pie chart slide template
- #data ratio visualization
- #donut graph presentation
- #4-segment circular chart
About the Product
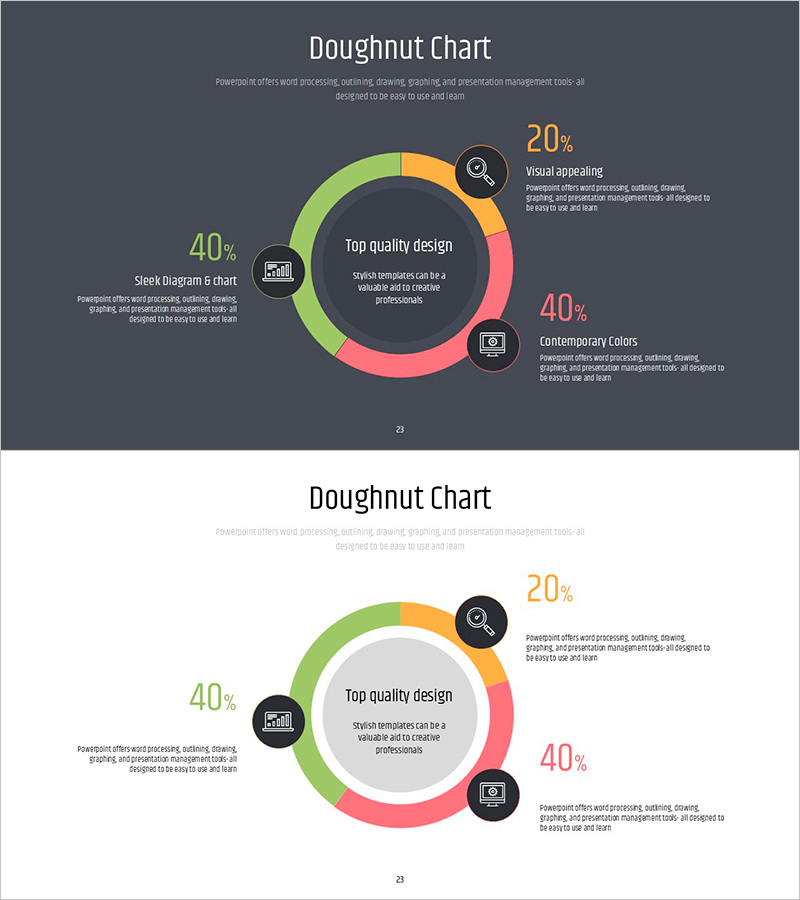
A professional doughnut chart PowerPoint slide designed for business performance and data comparison presentations. The slide features a four-segment donut graph with lime green, orange, and pink color segments on a dark background, with a central area for key messaging. Each segment includes an accompanying icon and descriptive text box for clear information delivery. The 2-slide set is optimized for 16:9 widescreen format and works seamlessly in executive reports, marketing performance analysis, business plan presentations, and strategic planning meetings. The layout allows for easy customization of percentages, labels, and supporting details.
Usage Points
-
Main Usage
Visualize business data composition and percentage distribution using an intuitive doughnut chart format. Ideal for executive reports, marketing analytics, business performance presentations, and financial overview discussions where complex numerical data needs to be communicated clearly and visually.
-
How to Use
Update the percentage values and category labels for each segment to match your data. Add your core message or title in the central text area, and include detailed descriptions for each category in the side text boxes. Colors and icons can be customized to match your brand guidelines.
-
Recommended For
Executive presentations and performance reports, marketing teams analyzing campaign results, finance departments explaining budget allocation, sales teams presenting customer composition, and strategic planning sessions requiring data visualization.
-
Slide Structure
Two-slide set featuring dark background version and light background version. Each slide contains a central 4-segment doughnut chart, left-side 40% data item with icon, right-side 20% and 40% data items with icons, and accompanying descriptive text boxes for each category.
Related Products
-

Donut Diagram Visualizing Technology Development Status
#Company Introduction #Product/Service Introduction #Diagram
-

Hologram Donut Chart PPT for Visualizing Key Achievements
#Company Introduction #Product/Service Introduction #Graph
-

Little Witch and Donut Chart – Visualizing Achievements in Presentation Slide
#Company Introduction #Product/Service Introduction #Graph
-

Doughnut Chart for Visualizing Key Achievements – Quality Presentation
#Company Introduction #Product/Service Introduction #Graph
