Hologram Donut Chart PPT for Visualizing Key Achievements
RJ0200053_6
- Last Update 04/14/2025
- File Size 0.4MB
- # of Slides 2
- File Format PPTX
- Slide Ratio 16:9
- Color
Keywords
- #Content-Based Slides
- #Design-Based Slides
- #Company Introduction
- #Product/Service Introduction
- #Graph
- #Key Achievements
- #Development Status
- #Circles
- #Doughnut Chart
- #16:9
- #donut chart PowerPoint
- #pie chart slide template
- #data visualization PowerPoint
- #performance metrics graph
- #how to create donut chart in PowerPoint
About the Product
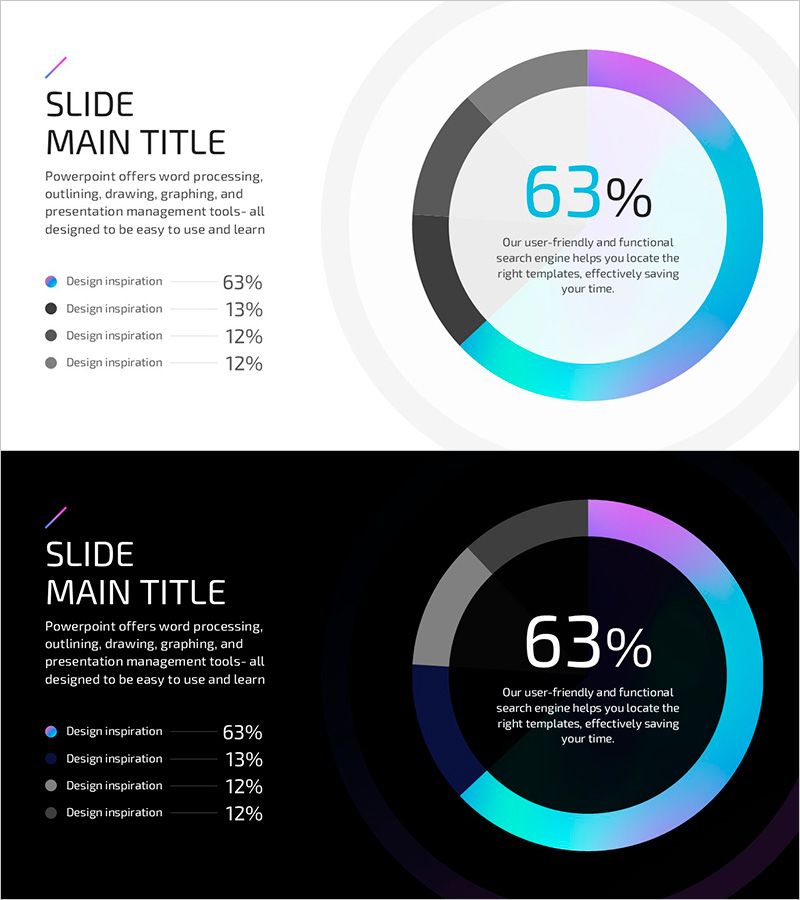
PowerPoint donut chart slide for visualizing key performance metrics and proportional data. Features a 4-segment circular graph with cyan, purple, and gray gradient effects, emphasizing the central metric (63%) prominently. Includes 2 slide layouts with both light and dark background versions to match your presentation theme. This PowerPoint graph template effectively communicates achievement rates, market share, customer satisfaction, and budget allocation in professional presentations and reports.
Usage Points
-
Main Usage
Displays proportional data such as achievement rates, market share, customer satisfaction scores, and budget distribution. The donut structure with centered metric emphasis draws audience attention and reinforces data credibility in executive presentations.
-
How to Use
Select the appropriate background version from 2 slide layouts. Edit segment colors and proportions to match your actual data, update the central metric value, and modify legend text to clearly identify each category. All elements are fully editable in PowerPoint.
-
Recommended For
Executive reports, business performance presentations, marketing analysis decks, investor pitch meetings, quarterly results sharing, and data-driven presentations in finance, consulting, marketing, and sales departments.
-
Slide Structure
Slide 1: Light gray background with 4-segment donut chart, cyan-colored central metric, left-aligned legend with 4 items / Slide 2: Dark background with identical donut structure, cyan-purple-gray gradient applied, matching metric and legend placement
Related Products
-

Visualizing Bicycle Performance with Donut Chart
#Company Introduction #Product/Service Introduction #Graph
-

Writing Instrument Icon Pie Chart – Company Introduction and Product Achievements
#Company Introduction #Product/Service Introduction #Graph
-

Doughnut Chart Slide for Dynamic Data Presentation – Vision of Achievement
#Company Introduction #Product/Service Introduction #Graph
-

Donut Charts in 4 Fields – Effective Performance Visualization
#Company Introduction #Product/Service Introduction #Graph
