Simple PowerPoint Wide Template Line Chart
RJ0200065_13
- Last Update 04/17/2025
- File Size 0.4MB
- # of Slides 2
- File Format PPTX
- Slide Ratio 16:9
- Color
Keywords
About the Product
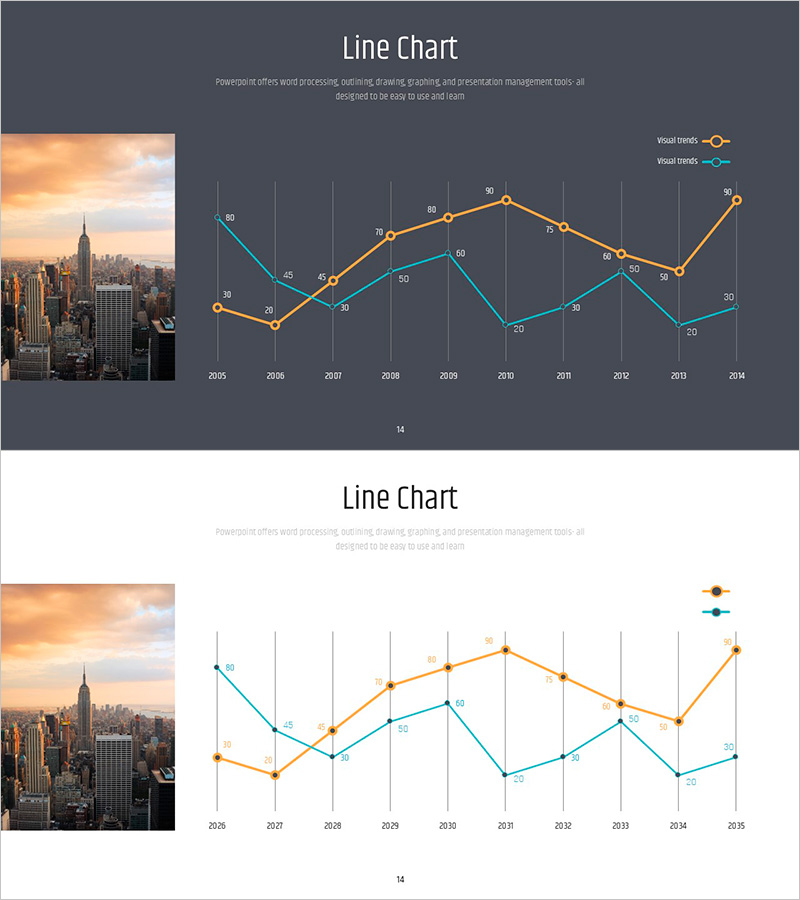
A two-series line chart PowerPoint slide that compares data changes over time from 2005 to 2014. Orange and teal lines represent two distinct trend lines with 10 data points, clearly labeled with numeric values. The dark gray background with white gridlines and axis labels ensures clarity in business presentations. This slide design is optimized for market analysis, competitive benchmarking, and performance tracking in pitch decks and reports. Available in 16:9 widescreen format with 2 fully editable slides.
Usage Points
-
Main Usage
Visualize and compare two data series over time to identify trends, patterns, and performance gaps. Ideal for displaying market share evolution, competitive performance comparison, revenue or customer growth trajectories, and industry benchmark trends across multiple years.
-
How to Use
Insert this slide into business reports, investor presentations, and strategic planning decks. Double-click the chart to edit data values, update axis labels, and modify legend text to match your presentation context. The dark background version suits projection environments; the light version works for printed materials and digital sharing.
-
Recommended For
Executives, business analysts, marketing strategists, sales leaders, and financial professionals presenting quarterly or annual performance reviews, market analysis, competitive positioning, and growth forecasts. Particularly effective in board meetings, investor relations presentations, and strategic planning sessions.
-
Slide Structure
Slide 1: Dark gray background with title area and dual-series line chart. Orange and teal lines connect 10 data points spanning 2005–2014, with numeric labels at each point and legend on the right side. Slide 2: Identical chart layout on white background for print-friendly and digital distribution purposes.
Related Products
-

Current Status Graph Analysis and Forecast – Market and Competitor Analysis
#Market and Competitor Analysis #Graph #Future Outlook
-

Curved Graphs and Analysis Messages – Market and Competitor Analysis
#Market and Competitor Analysis #Graph #Competitor Analysis
-

Real Estate Construction Status Graph – Market Analysis and Future Forecast
#Market and Competitor Analysis #Graph #Future Outlook
-

Trend Color Wide Template Line Chart – Market Trend Analysis
#Market and Competitor Analysis #Graph #Future Outlook
