Paint Splash Template Line Chart - Successful Business Strategy
RJ0200040_19
- Last Update 04/09/2025
- File Size 3.8MB
- # of Slides 2
- File Format PPTX
- Slide Ratio 16:9
- Color
Keywords
- #Content-Based Slides
- #Design-Based Slides
- #Business Strategy
- #Market and Competitor Analysis
- #Graph
- #Future Outlook
- #Line
- #Line Chart
- #Project Progress
- #16:9
- #line chart PowerPoint template
- #multi-series trend analysis slide
- #business performance presentation
- #time-series data visualization
- #10-year growth chart
About the Product
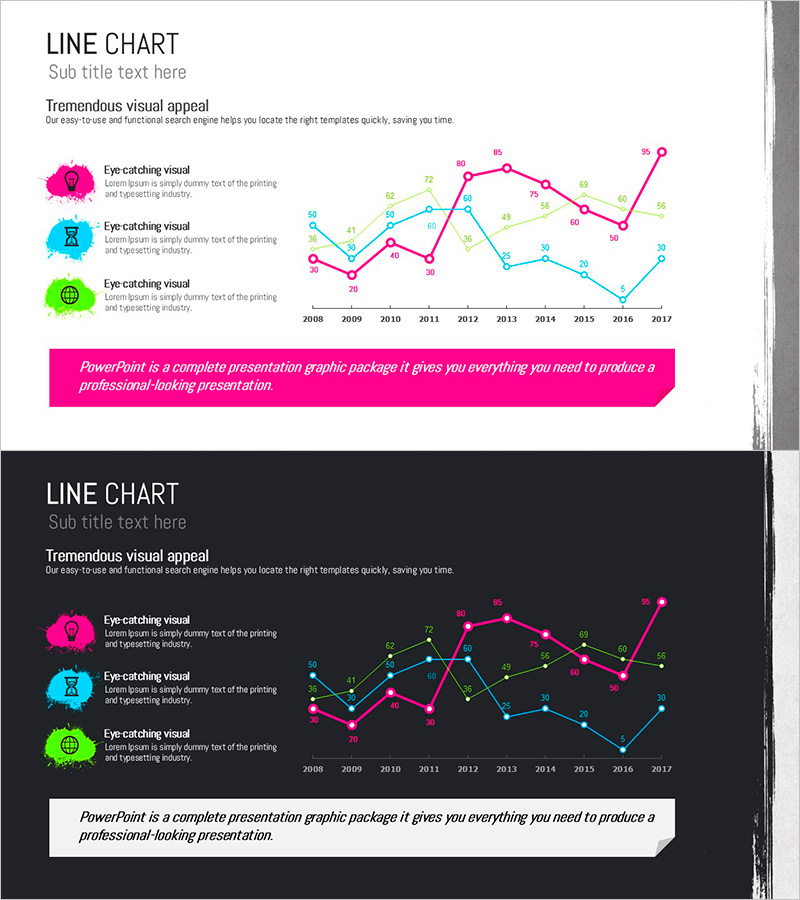
A professional multi-series line chart PowerPoint slide designed to visualize business progress and performance metrics over a decade. The slide displays three distinct data series (magenta, cyan, and lime green lines) tracking changes from 2008 to 2017, with clearly labeled data points and year markers on the X-axis. The left side features three icon-based explanation blocks for highlighting key insights, while the bottom right includes a magenta banner for inserting your main message. Provided in both light and dark background versions to suit different presentation environments. The 2-slide PPTX template is fully editable, allowing you to modify data values, axis labels, and legend text to match your specific metrics.
Usage Points
-
Main Usage
Ideal for presenting long-term business metrics, sales trends, market share evolution, and comparative performance analysis across multiple indicators. The three-line design enables side-by-side comparison of your company's growth trajectory against competitors or internal benchmarks, with precise year-by-year data points ensuring accuracy in financial and operational reporting.
-
How to Use
Insert this slide into executive reports, business plan presentations, investor pitch decks, and quarterly performance reviews. Customize the three icon labels to represent your specific metrics (revenue, customer count, market share, etc.), then update the chart data with your actual figures. Use the light background version for printed materials and PDF distribution; switch to the dark background for projector presentations and digital displays.
-
Recommended For
Executive presentations, board meetings, shareholder reports, quarterly business reviews, and investor relations materials. Particularly effective for CFOs, business development teams, and marketing departments presenting long-term strategic performance and growth narratives.
-
Slide Structure
Each slide contains a title area at the top, three icon-based explanation blocks on the left, a central multi-series line chart spanning 2008–2017 (10 X-axis points, 3 data series with 8–10 data points per series), and a magenta banner at the bottom right for key messaging. Both slides maintain identical layout with only background color variation.
Related Products
-

Visualizing Project Progress and Future Prospects – Journey to Success
#Business Strategy #Market and Competitor Analysis #Graph
-

Color Theme Presentation Template for Line Charts
#Business Strategy #Market and Competitor Analysis #Graph
-

Service Future Outlook Graph – Visualized in Blue, Orange, and Green
#Market and Competitor Analysis #Graph #Future Outlook
-

Future Outlook and Expected Effects Graph – Harmony of Blue and Orange
#Business Strategy #Market and Competitor Analysis #Graph
