Infographic Design Wide Template Donut Chart – A Fusion of Trust and Innovation
RJ0200064_9
- Last Update 04/17/2025
- File Size 0.3MB
- # of Slides 2
- File Format PPTX
- Slide Ratio 16:9
- Color
Keywords
- #Content-Based Slides
- #Design-Based Slides
- #Company Introduction
- #Product/Service Introduction
- #Graph
- #Key Achievements
- #Development Status
- #Circles
- #Doughnut Chart
- #16:9
- #donut chart PowerPoint slide
- #pie chart presentation template
- #data visualization PPT
- #circular graph slide design
- #percentage data PowerPoint
About the Product
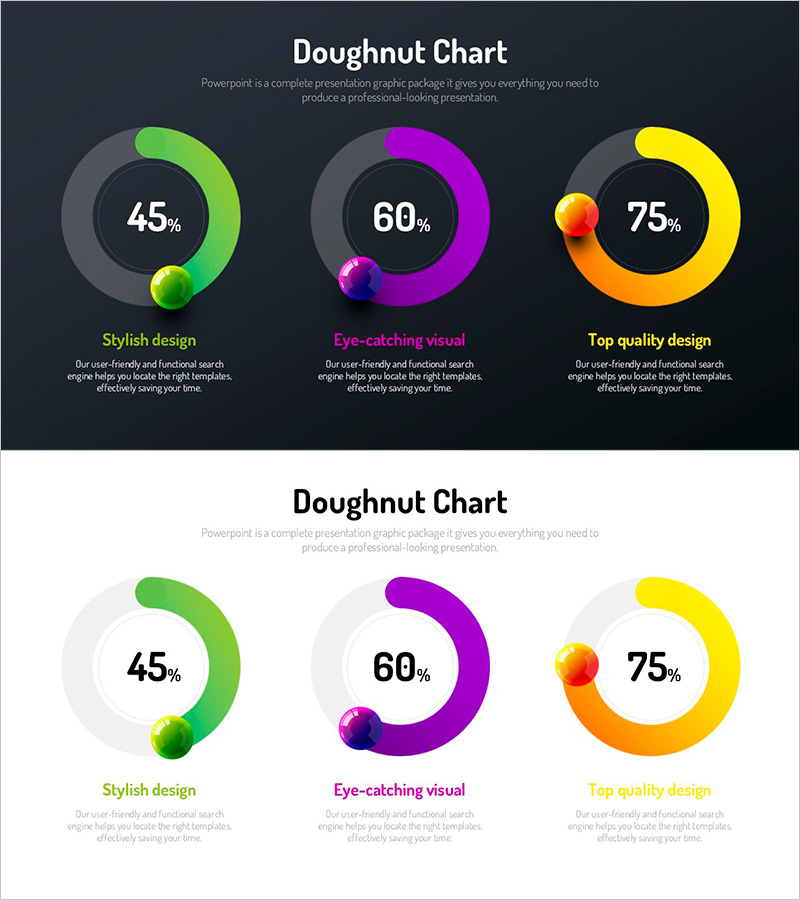
A professional donut chart PowerPoint slide template available in two layouts: dark background and light background. Features three gradient-colored circular charts (green, magenta, yellow) with centered percentage values and editable description text below each chart. Ideal for presenting ratio-based data such as company performance metrics, product features, market share, or customer satisfaction scores. The 16:9 widescreen format includes 2 slides ready for immediate customization and presentation use.
Usage Points
-
Main Usage
Visualize ratio-based data including company performance, product characteristics, market share, and customer satisfaction using donut-shaped circular charts. The centered numerical values and surrounding descriptive text emphasize key metrics, while gradient colors distinguish each data segment and capture audience attention.
-
How to Use
Use the dark background slide for projector presentations and online meetings; use the light background slide for printed materials and PDF distribution. Double-click the donut chart values and labels to edit them directly. Customize colors, add or remove data segments, and adjust text descriptions as needed.
-
Recommended For
Executive reports, quarterly performance presentations, product introduction decks, marketing proposals, investor pitch meetings, and business plans requiring effective quantitative data communication. Suitable for finance, IT, manufacturing, retail, and other industries needing clear data visualization.
-
Slide Structure
Slide 1 (dark background): Title area + 3 donut charts (displaying 45%, 60%, 75% values) + 3 editable description text boxes below. Slide 2 (light background): Identical structure with light background. All shapes and text elements are individually editable; chart data and color customization fully supported.
Related Products
-

Newspaper Wide PowerPoint Template with Donut Chart for Key Achievements
#Company Introduction #Product/Service Introduction #Graph
-

Hologram Donut Chart PPT for Visualizing Key Achievements
#Company Introduction #Product/Service Introduction #Graph
-

Square Frame Template Pie Chart – Elegance in Data Visualization
#Company Introduction #Product/Service Introduction #Graph
-

Donut Charts in 4 Fields – Effective Performance Visualization
#Company Introduction #Product/Service Introduction #Graph
