Square Frame Template Pie Chart – Elegance in Data Visualization
RJ0200014_6
- Last Update 04/01/2025
- File Size 4.4MB
- # of Slides 2
- File Format PPTX
- Slide Ratio 16:9
- Color
Keywords
About the Product
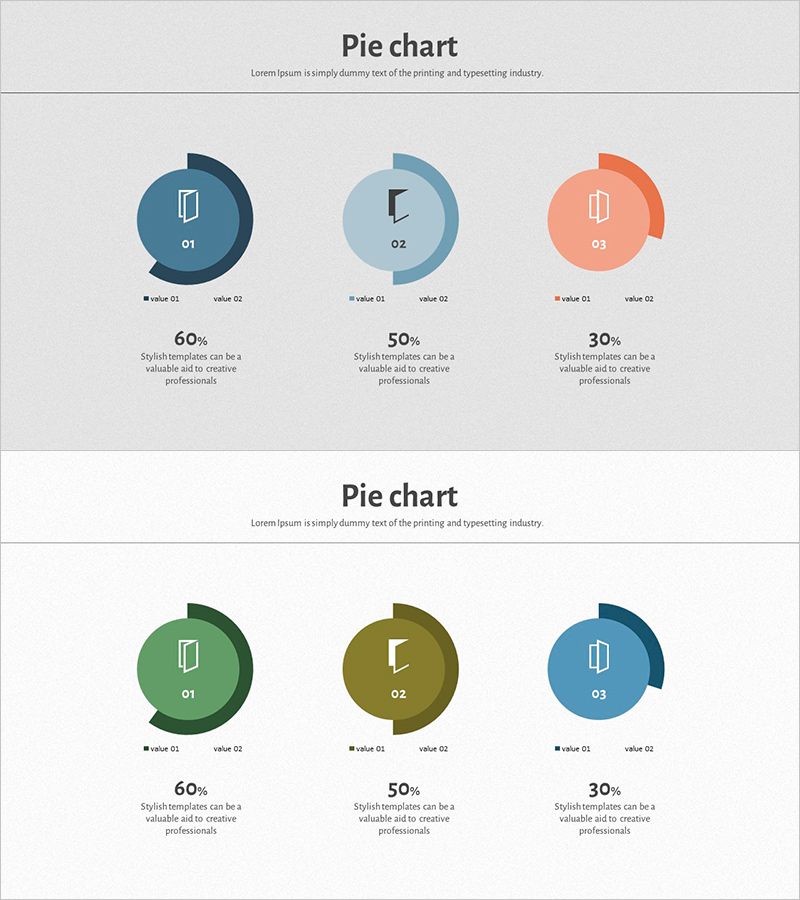
A two-slide PowerPoint set featuring three donut-shaped pie charts to represent proportional data across three categories. The slides showcase a cohesive color palette of dark blue, light blue, and coral tones, with each chart displaying dual data series (value 01 and value 02). Central icons and numbered labels (01, 02, 03) anchor each donut, while percentage values and descriptive text below provide context. Ideal for business presentations including company overviews, product introductions, and performance reports. Use this slide deck to visualize market share, budget allocation, customer satisfaction, or composition ratios. The 16:9 widescreen PPTX format ensures compatibility with all PowerPoint versions and enables seamless editing.
Usage Points
-
Main Usage
Effectively communicate proportional data such as market share, budget distribution, customer satisfaction ratings, or composition percentages. The donut structure allows central placement of key metrics or icons, creating clear information hierarchy and visual emphasis.
-
How to Use
Edit the donut chart colors and percentage values to match your dataset. Customize the central icons and numbered labels to represent your categories. Update the descriptive text below each chart to explain what each segment represents. Adjust colors to align with your brand guidelines.
-
Recommended For
Marketing professionals, financial analysts, business executives, product managers, and sales teams presenting market analysis, performance reports, budget status, customer demographics, or strategic breakdowns.
-
Slide Structure
Two-slide set. Each slide displays three donut pie charts arranged horizontally. Each chart contains two data series (value 01, value 02), central icon with number label (01–03), and percentage with descriptive text below. 16:9 widescreen format, PPTX file.
Related Products
-

Doughnut Chart Slide for Dynamic Data Presentation – Vision of Achievement
#Company Introduction #Product/Service Introduction #Graph
-

Visualizing Simple Design Trend with Donut Chart PPT
#Company Introduction #Product/Service Introduction #Graph
-

Newspaper Wide PowerPoint Template with Donut Chart for Key Achievements
#Company Introduction #Product/Service Introduction #Graph
-

Donut Diagram Visualizing Technology Development Status
#Company Introduction #Product/Service Introduction #Diagram
