Electricity and Water Usage Graphs – Market Status and Future Trends
RJ0600067_9
- Last Update 07/08/2025
- File Size 0.3MB
- # of Slides 2
- File Format PPTX
- Slide Ratio 16:9
- Color
Keywords
About the Product
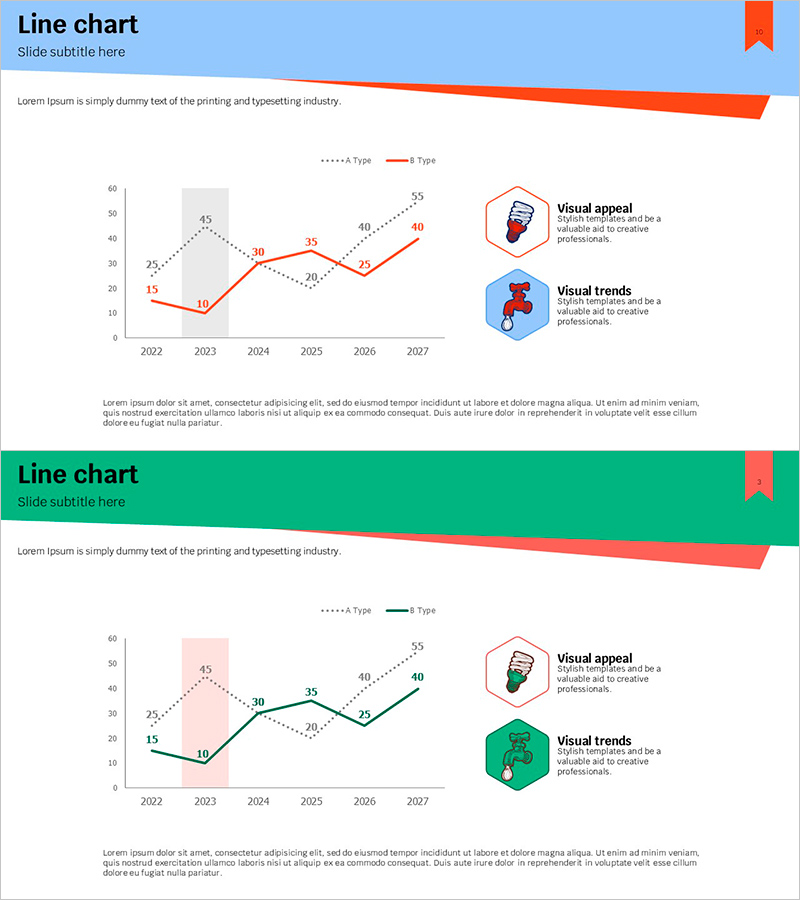
A dual-series line chart PowerPoint slide comparing data trends from 2022 to 2027 with blue dotted and red solid lines. Each data point displays numerical values for precise information delivery. Two design versions are provided with light blue and green headers, featuring hexagonal icon boxes on the right to emphasize key messages. This presentation slide is ready to use for market analysis, performance reporting, and future outlook presentations across various business contexts.
Usage Points
-
Main Usage
Designed to compare and analyze two data series over time, showing how different metrics evolve simultaneously. Ideal for year-over-year performance comparison, competitive benchmarking, market indicator trends, and multi-variable analysis requiring clear visual representation.
-
How to Use
Edit the slide title and description text at the top. Double-click the chart to modify data values with your actual figures. Adjust the legend and axis labels as needed, then add key insights to the hexagonal text boxes on the right. Choose between the blue or green header version based on your presentation theme.
-
Recommended For
Financial reports showing revenue and profit trends, marketing plans with competitor performance analysis, business proposals presenting market forecasts, investor pitch decks comparing growth rates, operational reports tracking key performance indicators, and strategic planning documents.
-
Slide Structure
Dual-series line chart (6 time points from 2022-2027, 5-6 data points per series), X-axis year labels, Y-axis numerical scale (0-60), legend (Type A and Type B), two hexagonal text boxes on right (Visual appeal and Visual trends), colored header banner (blue or green), ribbon icon accent
Related Products
-

Four Color Infographic Presentation Template – Market Status and Forecast
#Market and Competitor Analysis #Graph #Market Status
-

Successful Proposition Strategy through Market and Competitive Analysis
#Market and Competitor Analysis #Graph #Market Status
-

Market Status and Future Outlook – Data Illustrated in Blue and Yellow
#Market and Competitor Analysis #Graph #Market Status
-

Simple Circle Presentation Template Line Chart – Visualizing Market Status
#Market and Competitor Analysis #Graph #Market Status
