Infographic Slide Visualizing App Market Sales Trends
RJ0800049_25
- Last Update 08/14/2025
- File Size 0.6MB
- # of Slides 2
- File Format PPTX
- Slide Ratio 16:9
- Color
Keywords
- #Content-Based Slides
- #Design-Based Slides
- #Business Strategy
- #Market and Competitor Analysis
- #Graph
- #Achievements
- #Market Status
- #Line
- #Line Chart
- #16:9
- #line chart PowerPoint
- #trend analysis slide template
- #dual series graph
- #time series data visualization
- #sales trend chart
- #comparative analysis presentation
About the Product
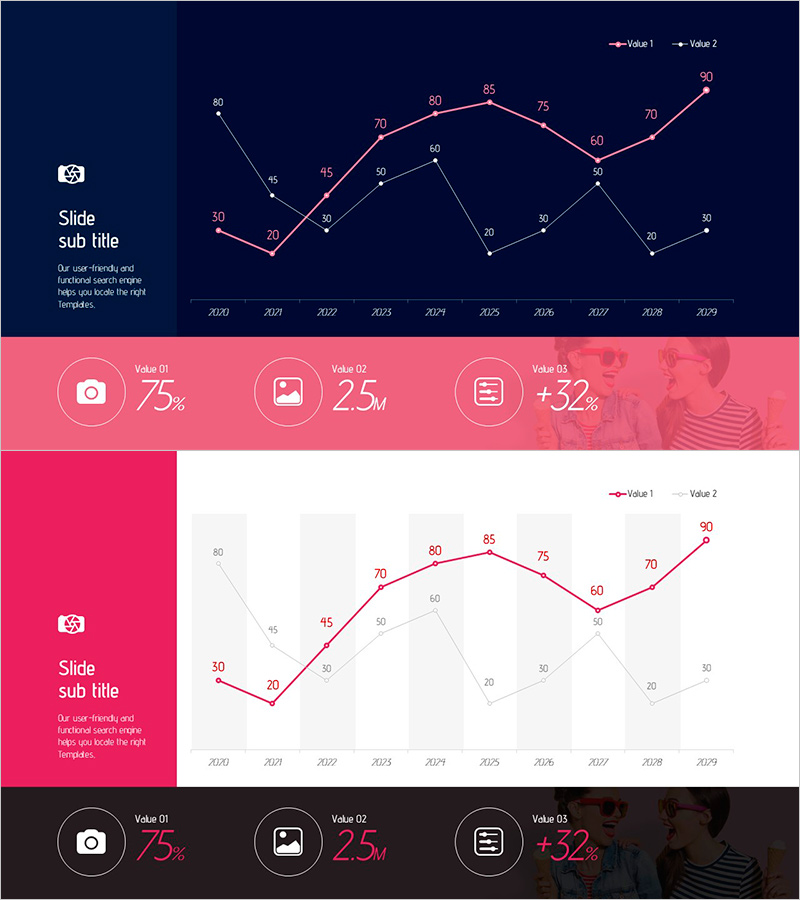
A PowerPoint slide visualizing app market sales trends using dual-series line charts spanning 2020 to 2029. Each data point is clearly labeled with numerical values, making year-over-year comparisons intuitive. The design features a dark navy background with coral pink lines on the primary slide, complemented by a white background variant with matching line styling. This 2-slide presentation template is ready for immediate data input and works seamlessly in business reports, market analysis decks, and financial presentations.
Usage Points
-
Main Usage
Visualize numerical changes over time using two or more data series for comparative analysis. Ideal for displaying sales trends, market growth rates, competitive benchmarking, and performance metrics to support strategic decision-making with clear visual evidence.
-
How to Use
Insert into business strategy, market analysis, competitive analysis, or performance reporting sections. Replace sample data with actual figures—the chart automatically updates. Customize axis labels, legend text, and color schemes to match your presentation branding and narrative flow.
-
Recommended For
Marketing plans, business proposals, investor pitch decks, quarterly and annual performance reports. Recommended for executives, strategists, and analysts in software, fintech, retail, manufacturing, and data-driven industries presenting growth metrics and market positioning.
-
Slide Structure
Two-slide template with distinct color themes. Slide 1: dark navy background with coral pink dual-series lines. Slide 2: white background with matching pink lines. Each includes 2 data series, 10 data points (2020–2029), legend, axis labels, and gridlines. Optimized for 16:9 widescreen format with editable data fields.
Related Products
-

Curve Graph of a Meal – Business Strategy
#Business Strategy #Market and Competitor Analysis #Graph
-

Sewing Graph Chart – Market Status and Performance Analysis
#Business Strategy #Market and Competitor Analysis #Diagram
-

Market Analysis Broken Line Graph – Visualizing Business Performance
#Business Strategy #Market and Competitor Analysis #Graph
-

Origami Line Chart Slide - Visualizing Business Performance
#Business Strategy #Market and Competitor Analysis #Graph
