Infographic Design Wide Template Chart – Market and Competitor Analysis
RJ0200064_10
- Last Update 10/17/2025
- File Size 0.4MB
- # of Slides 2
- File Format PPTX
- Slide Ratio 16:9
- Color
Keywords
About the Product
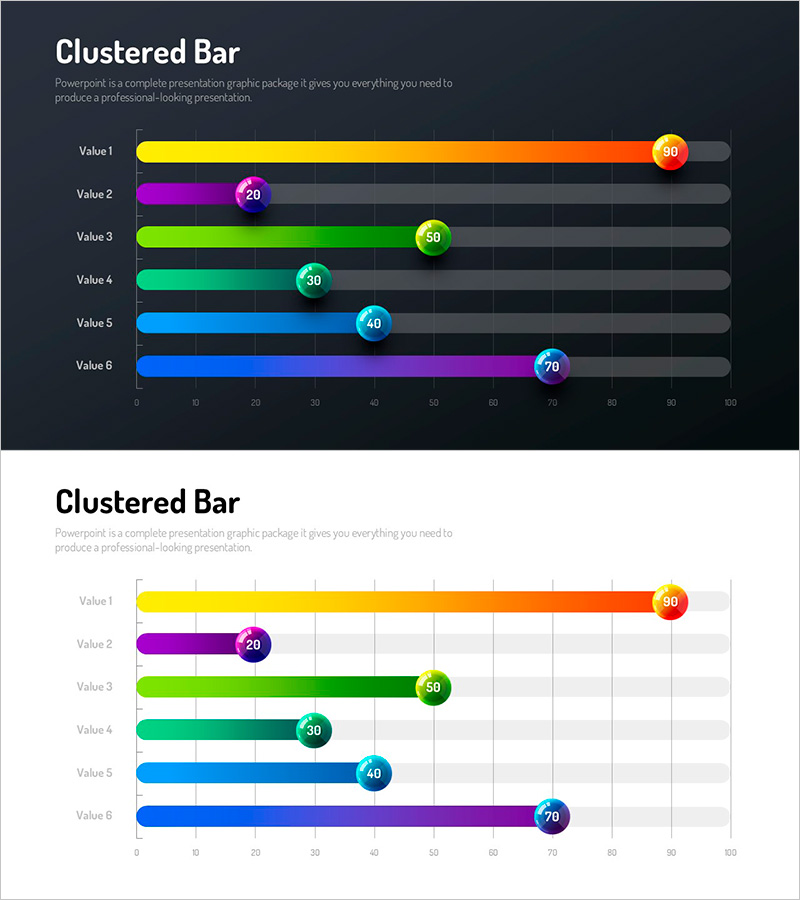
A clustered bar chart PowerPoint slide designed to visually compare six data values side by side. This presentation slide includes two versions: a dark-background design for a professional tone and a light-background design for clarity and readability. Each bar features a gradient color scheme in yellow, purple, lime, cyan, blue, and navy, with circular badges displaying exact values (90, 20, 50, 30, 40, 70). Perfect for financial analysis, market research, competitive benchmarking, and performance reporting. The 16:9 widescreen format ensures compatibility with modern presentation systems.
Usage Points
-
Main Usage
This slide excels at displaying multiple data points in a single, easy-to-read format. It enables quick visual comparison of values across categories, making it ideal for presenting financial metrics, sales performance, market share, and competitive positioning data.
-
How to Use
Edit the circular badges to input your actual data values, then adjust the bar lengths proportionally to match your figures. The 0-100 scale axis provides a reference framework. Choose the dark version for executive presentations or the light version for printed materials and web-based presentations.
-
Recommended For
Finance teams presenting quarterly earnings, marketing departments showcasing market research findings, executives comparing competitor performance, and investment professionals highlighting competitive advantages. Works best when comparing 4-6 items simultaneously.
-
Slide Structure
Each slide contains a title area, a legend section, and six horizontal bar chart data areas with corresponding value badges. The 0-100 scale axis runs horizontally across the bottom. All text elements—title, value labels, and category names—are fully editable for customization.
Related Products
-

Real Estate Interactive Horizontal Bar Graph – Market Analysis and Performance
#Market and Competitor Analysis #Financial Plans and Performance #Graph
-

Two Comparison Tables and Radar Charts - Financial Analysis and Competitive Advantage
#Market and Competitor Analysis #Financial Plans and Performance #Diagram
-

Analysis of Bakery and Seafood Market Trends with Bar and Column Charts
#Market and Competitor Analysis #Financial Plans and Performance #Graph
-

Graph Slide Visualizing Average Monthly Eating Out Consumption Trends
#Market and Competitor Analysis #Financial Plans and Performance #Graph
