Real Estate Interactive Horizontal Bar Graph – Market Analysis and Performance
RJ0900002_25
- Last Update 08/16/2025
- File Size 0.1MB
- # of Slides 2
- File Format PPTX
- Slide Ratio 16:9
- Color
Keywords
- #Content-Based Slides
- #Design-Based Slides
- #Market and Competitor Analysis
- #Financial Plans and Performance
- #Graph
- #Competitive Advantage
- #Sales and Revenue
- #Horizontal Bar
- #Double Horizontal Bar
- #16:9
- #bidirectional horizontal bar chart PowerPoint
- #horizontal bar graph presentation slide
- #data comparison chart template
- #real estate market analysis presentation
- #category performance comparison slide
About the Product
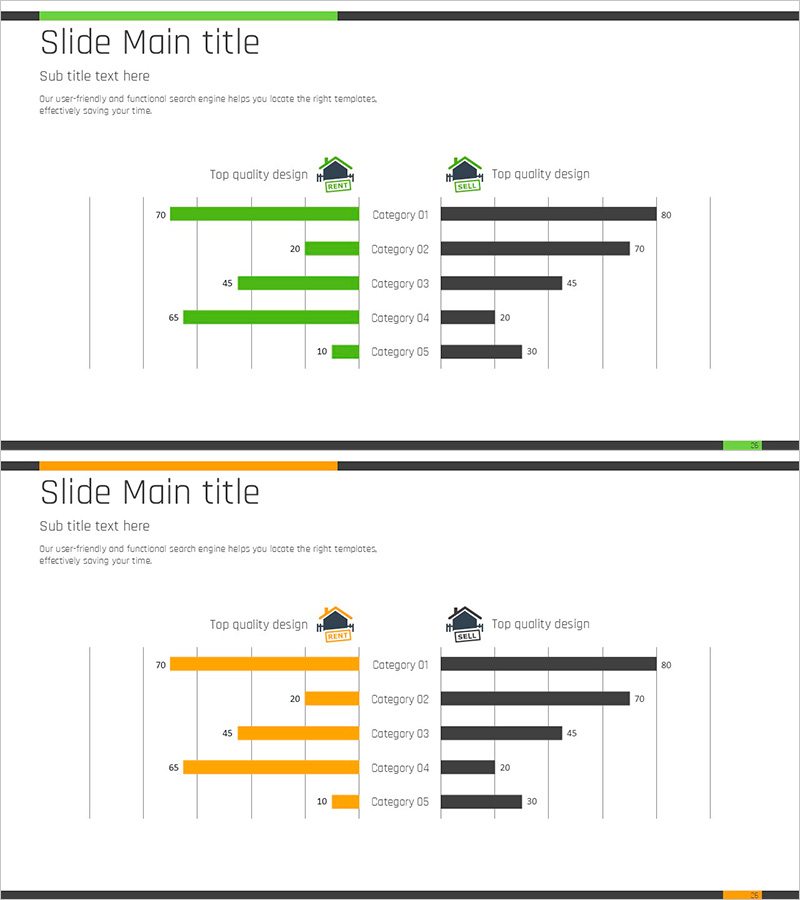
A bidirectional horizontal bar chart PowerPoint slide optimized for real estate market analysis and performance comparison. This presentation template features contrasting green bars on the left and black bars on the right, enabling simultaneous visualization of two data series across five categories (01-05) for intuitive side-by-side comparison. The editable structure automatically adjusts bar lengths when you input numerical data, making it immediately applicable to real estate project evaluation, market share analysis, financial performance reporting, and competitive benchmarking. Provided as a 2-slide set in 16:9 widescreen format.
Usage Points
-
Main Usage
This bidirectional horizontal bar chart specializes in comparing two data series displayed symmetrically left and right, ideal for real estate market analysis, competitive benchmarking, and performance evaluation. The distinct green and black color scheme emphasizes the contrast between two groups, making comparative insights immediately visible.
-
How to Use
Insert this slide into real estate project presentations, market share analysis reports, financial performance dashboards, and executive briefings where category-by-category numerical comparison is required. Simply input your data values and the bar lengths automatically adjust, allowing quick reuse across multiple presentations.
-
Recommended For
Real estate professionals, marketing managers, financial analysts, executive report writers, and market research specialists who need to quickly prepare data-driven presentations. Particularly effective when comparing two metrics or performance indicators simultaneously across multiple categories.
-
Slide Structure
2-slide set featuring bidirectional horizontal bar charts for 5 categories (01-05). Each slide displays green bars on the left (maximum value 70) and black bars on the right (maximum value 80), with numerical labels beside each category. A title area and 'Top quality design' icon at the top allow clear identification of slide topics.
Related Products
-

Sales Comparison Graph by Product – Competitive Advantage and Performance Analysis
#Market and Competitor Analysis #Financial Plans and Performance #Graph
-

Competitive Comparison Analysis Bar Graph – Visualizing Market Advantage
#Market and Competitor Analysis #Graph #Competitor Analysis
-

Market Analysis Visualization with Bar Chart – Your Competitive Advantage Slide
#Market and Competitor Analysis #Financial Plans and Performance #Graph
-

Competitor Analysis and Competitive Advantage – Red, Blue, Purple Bar Chart
#Market and Competitor Analysis #Graph #Competitor Analysis
