Two Comparison Tables and Radar Charts - Financial Analysis and Competitive Advantage
RJ0900011_11
- Last Update 08/18/2025
- File Size 0.1MB
- # of Slides 2
- File Format PPTX
- Slide Ratio 16:9
- Color
Keywords
- #Content-Based Slides
- #Design-Based Slides
- #Market and Competitor Analysis
- #Financial Plans and Performance
- #Diagram
- #Graph
- #Competitive Advantage
- #Sales and Revenue
- #Table
- #Other
- #Radar Chart Spider Chart
- #16:9
- #radial radar chart PowerPoint
- #radar chart slide template
- #financial analysis diagram
- #competitive advantage comparison
- #5-axis radar chart template
- #PowerPoint data visualization
About the Product
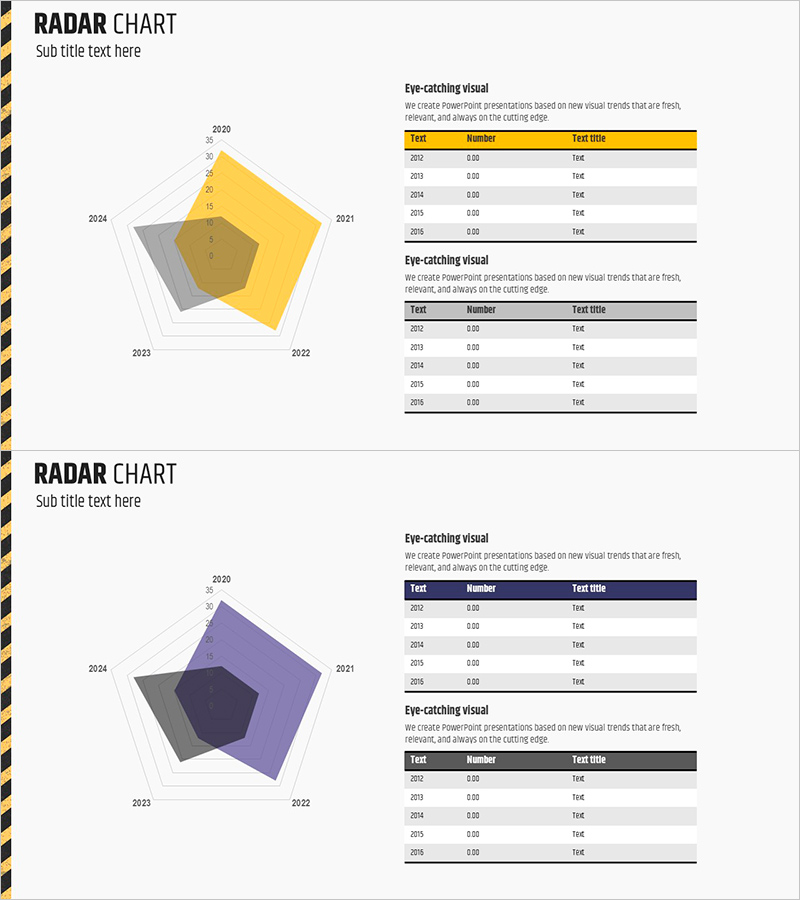
A comprehensive PowerPoint slide featuring dual 5-axis radial radar charts paired with comparison tables for multi-dimensional data visualization. Two color schemes—golden yellow and deep purple—represent different data series across years 2020 to 2024, enabling side-by-side competitive analysis. Each slide includes two editable data tables positioned on the right, allowing real-time chart updates as you input financial metrics, performance indicators, or competitive benchmarks. The 16:9 widescreen format with 2-slide layout is ready for immediate customization and ideal for financial presentations, competitive positioning reports, and organizational capability assessments.
Usage Points
-
Main Usage
Enable comprehensive multi-metric comparison using radial visualization. Perfect for analyzing 5+ dimensions simultaneously—financial performance, competitive positioning, organizational capabilities, market metrics, or operational KPIs. Dual color series allow direct contrast analysis, and year-over-year trend changes are immediately apparent in the radial structure.
-
How to Use
Input numerical data into the editable tables on each slide; radar charts update automatically. Deploy in financial reports' performance analysis sections, executive briefings, investor presentations, or organizational capability assessments where you need to highlight strengths and improvement areas across multiple dimensions.
-
Recommended For
CFOs and finance teams presenting financial performance, executives reporting competitive advantage analysis, marketing teams analyzing market positioning, management consultants delivering diagnostic reports, and academic researchers presenting comparative analysis findings.
-
Slide Structure
Slide 1: Golden yellow 5-axis radial radar chart with two comparison tables on the right (5 rows for years 2020–2024, 3 columns for metric name, value, and title). Slide 2: Deep purple 5-axis radial radar chart with identical table structure. Both slides maintain consistent data input areas for seamless multi-series comparison.
Related Products
-

Sales and Profit Analysis Tables & Graphs – Data-Driven Insights
#Market and Competitor Analysis #Financial Plans and Performance #Diagram
-

Typographic Wide Template Bar Chart & Table – Competitive Analysis and Performance
#Market and Competitor Analysis #Financial Plans and Performance #Diagram
-

Competitor Market Analysis Graph – Financial Performance and Competitive Advantage
#Market and Competitor Analysis #Financial Plans and Performance #Diagram
-

Construction Business Estimated Income Report – Effective Diagram for Financial Performance
#Financial Plans and Performance #Diagram #Income Statement
