Spring Pastel Wide PowerPoint Template Pie Chart
RJ0200063_8
- Last Update 04/17/2025
- File Size 0.4MB
- # of Slides 2
- File Format PPTX
- Slide Ratio 16:9
- Color
Keywords
- #Content-Based Slides
- #Design-Based Slides
- #Business Strategy
- #Financial Plans and Performance
- #Graph
- #Achievements
- #Sales and Revenue
- #Circles
- #Pie Chart
- #16:9
- #pie chart PowerPoint slide
- #donut chart template
- #ratio visualization slide
- #data chart PowerPoint
- #percentage comparison slide
- #financial data presentation
About the Product
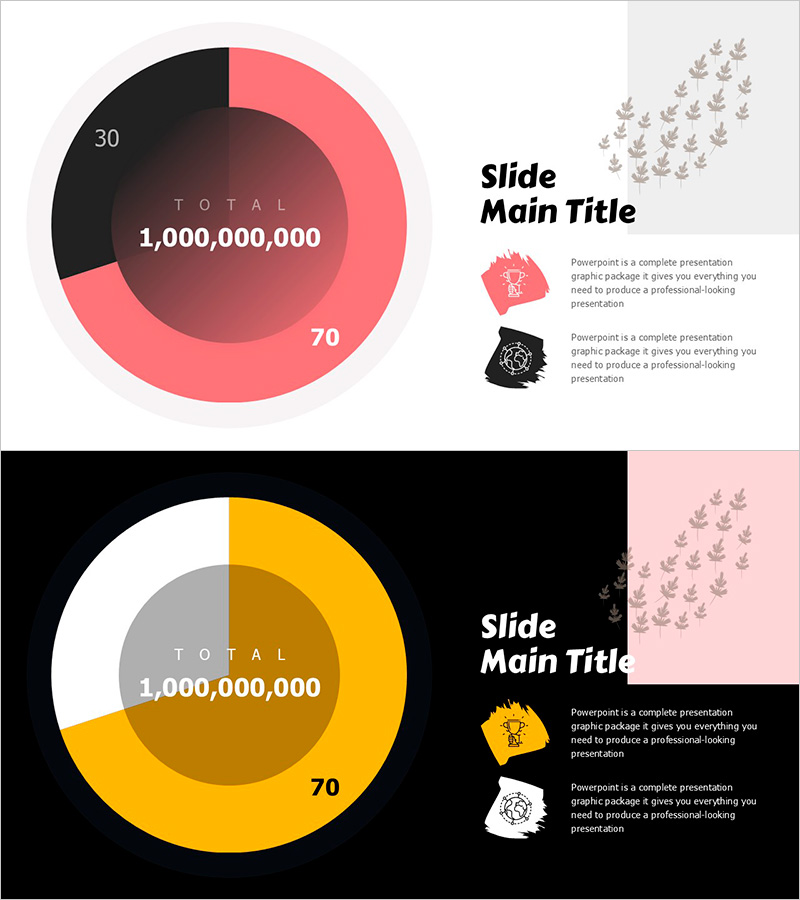
A 2-slide pie chart PowerPoint template featuring spring pastel pink and black color scheme. The donut-style pie chart displays total figures in the center with ratio percentages (30, 70) positioned on the outer ring for intuitive data comparison. Designed in 16:9 widescreen PPTX format, this presentation slide is optimized for financial reports, performance analysis, business progress tracking, and ratio-based data visualization. The contrast between light pastel background and dark segments emphasizes key metrics, while integrated icon elements enhance visual completeness and professional appearance.
Usage Points
-
Main Usage
Visualizes the ratio relationship between two data categories such as financial status, revenue composition, performance metrics, or market share. The center area highlights total figures or key indicators, while outer percentages display each segment's proportional contribution in a donut chart format.
-
How to Use
Apply to financial report revenue breakdown sections, business plan goal achievement rates, marketing plan channel distribution analysis, and performance report comparisons. Edit the center text box and outer percentage values with your own data for immediate use in presentations.
-
Recommended For
Finance professionals, business planning teams, marketing specialists, and executives presenting quantitative data. Particularly suitable for analysis materials requiring two-item ratio comparison and stakeholder reporting.
-
Slide Structure
2-slide set. Slide 1: Light gray background with pink (70%) and black (30%) donut pie chart, center displays '1,000,000,000' figure. Slide 2: Black background with yellow-brown donut chart, right side contains title area and two icon-based text boxes for descriptions. 16:9 widescreen PPTX format.
Related Products
-

Vertical General Bar Chart – Clear Performance Analysis
#Business Strategy #Financial Plans and Performance #Graph
-

Kids Drawing Line Graph – Emphasizing Performance
#Business Strategy #Financial Plans and Performance #Graph
-

Striking Performance Gap in Agricultural Outcomes
#Business Strategy #Financial Plans and Performance #Graph
-

Visualizing Annual Sales Performance Trends - Graph Slide
#Business Strategy #Financial Plans and Performance #Graph
