Paint Splash Pie Chart Slide – Revenue Analysis and Performance Visualization
RJ0200040_10
- Last Update 04/09/2025
- File Size 3.7MB
- # of Slides 2
- File Format PPTX
- Slide Ratio 16:9
- Color
Keywords
- #Content-Based Slides
- #Design-Based Slides
- #Market and Competitor Analysis
- #Financial Plans and Performance
- #Graph
- #Competitor Analysis
- #Sales and Revenue
- #Circles
- #Pie Chart
- #16:9
- #pie chart PowerPoint slide
- #4-segment pie chart template
- #revenue analysis chart
- #ratio visualization slide
- #financial data PowerPoint
- #how to create pie chart in PowerPoint
About the Product
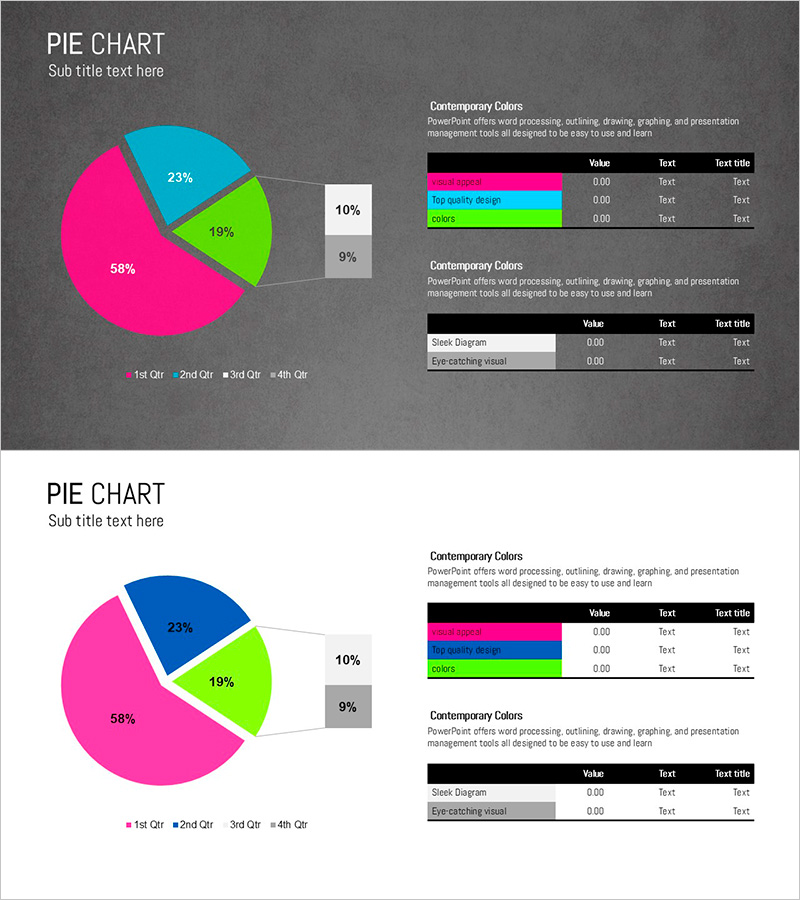
A professional pie chart PowerPoint slide designed for revenue analysis and performance visualization with four distinct segments. The slide features a dark gray background with contrasting cyan, magenta, and lime colors to highlight each data category, accompanied by percentage labels and reference tables. Available in two background variations (dark and light), this 2-slide presentation template enables clear representation of financial ratios and is ready to use in financial reports, marketing analysis, and business performance presentations.
Usage Points
-
Main Usage
This pie chart slide is designed to present financial data composition ratios at a glance. The four segments are color-coded for easy distinction, with percentage labels and accompanying data tables that ensure accurate information delivery and professional presentation quality.
-
How to Use
Use this slide in business performance reports, financial analysis presentations, and marketing performance reviews to explain composition ratios. Simply edit the segment values and table data to match your actual figures, then the slide is ready for immediate presentation use.
-
Recommended For
Finance teams, executives, marketing managers, and sales directors presenting quarterly or annual performance results. Ideal for budget allocation, revenue structure analysis, market share comparisons, and any presentation requiring ratio-based data visualization.
-
Slide Structure
Slide 1: Dark gray background with 4-segment pie chart (cyan 23%, magenta 58%, lime 19%, gray 9%), percentage labels, and two reference tables / Slide 2: Light background with identical layout. 16:9 aspect ratio, PPTX format with fully editable elements.
Related Products
-

Logistics Data by Year Pie Chart – Strategy for Competitor Analysis
#Market and Competitor Analysis #Diagram #Graph
-

Red Orange Curved Line Trend Analysis – Market Insights
#Market and Competitor Analysis #Financial Plans and Performance #Diagram
-

Pie Chart and Table Metrics – Market Share Analysis
#Market and Competitor Analysis #Financial Plans and Performance #Diagram
-

Origami Vision Donut Chart 2 – Market Analysis and Performance
#Market and Competitor Analysis #Financial Plans and Performance #Graph
