Market Analysis with Five Color Pie Charts – Stylish Design
RJ0200009_9
- Last Update 03/30/2025
- File Size 4.5MB
- # of Slides 2
- File Format PPTX
- Slide Ratio 16:9
- Color
Keywords
- #Content-Based Slides
- #Design-Based Slides
- #Market and Competitor Analysis
- #Financial Plans and Performance
- #Graph
- #Market Status
- #Sales and Revenue
- #Circles
- #Pie Chart
- #16:9
- #pie chart PowerPoint slide
- #circular chart template
- #market analysis presentation
- #5-segment pie chart
- #business data visualization
- #pie chart download
About the Product
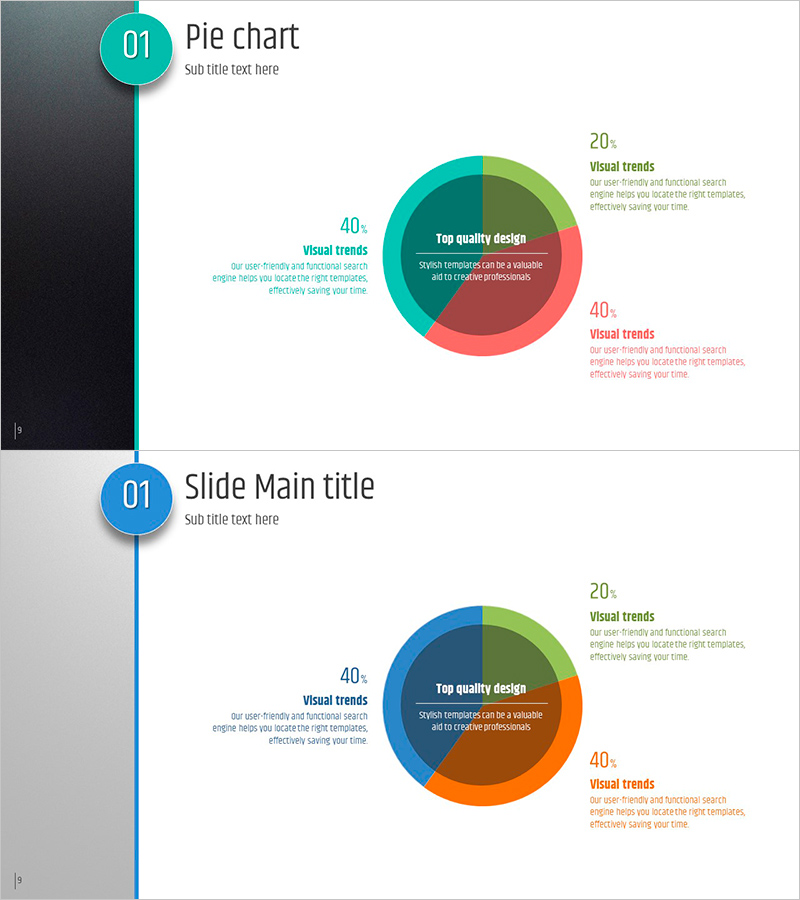
A professional PowerPoint slide designed for market analysis and business performance reporting. The pie chart features five color segments—teal, lime, pink, and brown—to intuitively represent data proportions, complemented by a left-aligned timeline structure that emphasizes trend changes over time. Each segment includes percentage labels and descriptive text, making it ideal for presenting financial planning, market share, customer composition analysis, and other business metrics. The 2-slide set is ready for immediate use in presentations and business reports.
Usage Points
-
Main Usage
Clearly express the proportion of each item relative to the whole using a pie chart. Designed to present market share, customer composition, budget allocation, and sales channel analysis at a glance. The left-aligned timeline element emphasizes temporal changes, supporting dynamic presentations.
-
How to Use
Ideal for executive briefings, investor presentations, marketing strategy discussions, and quarterly performance reports. Simply edit the percentages and text labels with your own data for immediate use. Colors can be adjusted to match your corporate brand guidelines.
-
Recommended For
Finance managers, marketing professionals, business planners, and executives who need to communicate quantitative data persuasively. Particularly effective for presentations involving market analysis, customer segmentation, budget distribution, and sales performance reviews.
-
Slide Structure
2-slide set featuring a teal-background timeline combined with a 5-segment pie chart on the first slide, and a blue-background variation with orange and brown tones on the second. Each slide positions the central pie chart with four segment percentage labels and descriptive text areas around it, maximizing data readability.
Related Products
-

Idea Presentation Template for Visualizing Sales Status – Success and Challenge
#Market and Competitor Analysis #Financial Plans and Performance #Graph
-

Triangle Pattern PPT Template for Visualizing Market Share with Pie Charts
#Market and Competitor Analysis #Graph #Market Status
-

Market Status and Share Analysis Slide – The Harmony of Blue and Orange
#Market and Competitor Analysis #Graph #Market Status
-

Rainbow Presentation Template Bilateral Bar Graph – Market Status and Financial Analysis
#Market and Competitor Analysis #Financial Plans and Performance #Graph
