Four Color Infographic Presentation Table – Visualizing Financial Performance
RJ0200037_19
- Last Update 04/08/2025
- File Size 0.2MB
- # of Slides 2
- File Format PPTX
- Slide Ratio 16:9
- Color
Keywords
About the Product
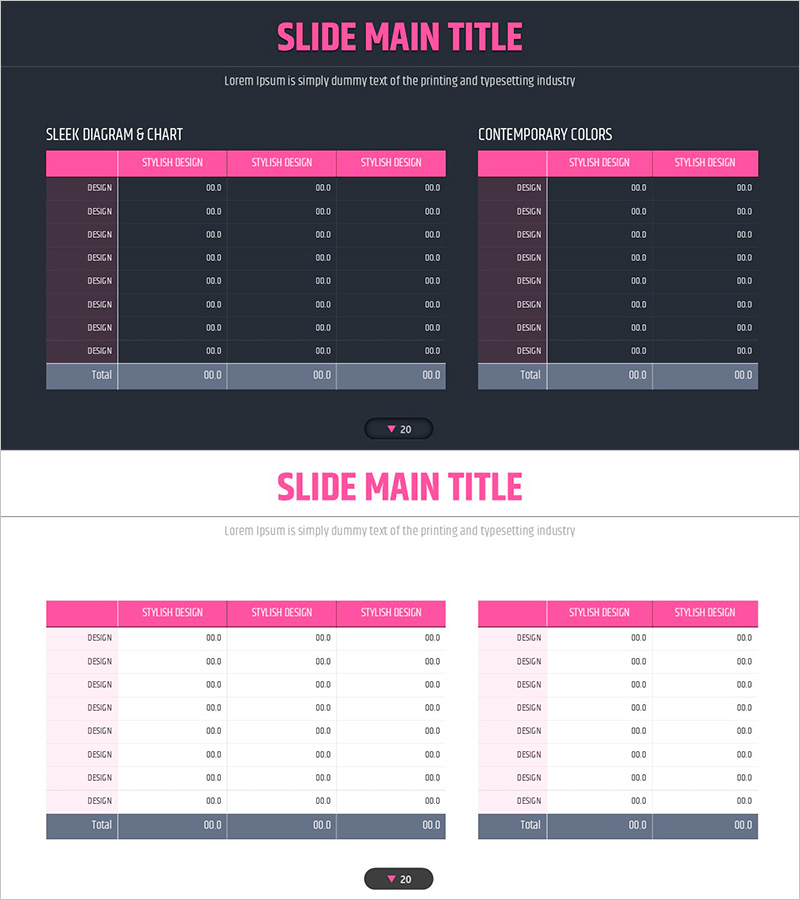
A professional infographic table PowerPoint slide that visualizes financial performance and business metrics using four distinct colors. Featuring a dark background with pink, lavender, blue, and gray header rows, this two-slide deck includes dual table layouts with 3 columns and 8 data entry rows each. Perfect for presenting financial plans, performance analysis, departmental metrics, and comparative data in presentations, reports, and business proposals. Fully editable and ready to use immediately.
Usage Points
-
Main Usage
Display quantitative data such as financial performance, business metrics, and departmental results with color-coded headers for clear categorization. The dark background enhances data contrast and captures audience attention while maintaining professional presentation standards.
-
How to Use
Double-click table headers and data cells to input your information. Align color-coded headers with your data categories, maintain consistent formatting for numbers, percentages, and currency values, and ensure visual consistency across both slides for maximum impact.
-
Recommended For
Finance teams, executives, marketing managers, and sales leaders presenting quarterly or annual performance reports, budget planning, departmental comparisons, and investor presentations. Ideal for board meetings, strategy sessions, and data-driven decision-making forums.
-
Slide Structure
Two identical slides with dark background (charcoal/gray) featuring two side-by-side tables with pink, lavender, blue, and gray headers. Each table contains 3 columns and 8 data rows plus a total row. 16:9 widescreen format with balanced left-right margins for professional appearance.
Related Products
-

Spring Pastel Wide PowerPoint Template Tables – Design for Financial Performance
#Financial Plans and Performance #Diagram #Balance Sheet
-

Slide Visualizing Financial Plans with Diagonal Box and Table
#Financial Plans and Performance #Diagram #Balance Sheet
-

Triangular Pattern Presentation Table - Financial Plans and Performance
#Financial Plans and Performance #Diagram #Balance Sheet
-

Business Plan PowerPoint Design – Excel Table Utilization
#Financial Plans and Performance #Diagram #Balance Sheet
