Business Plan PowerPoint Design – Excel Table Utilization
RJ0200027_33
- Last Update 04/05/2025
- File Size 1.8MB
- # of Slides 2
- File Format PPTX
- Slide Ratio 16:9
- Color
Keywords
About the Product
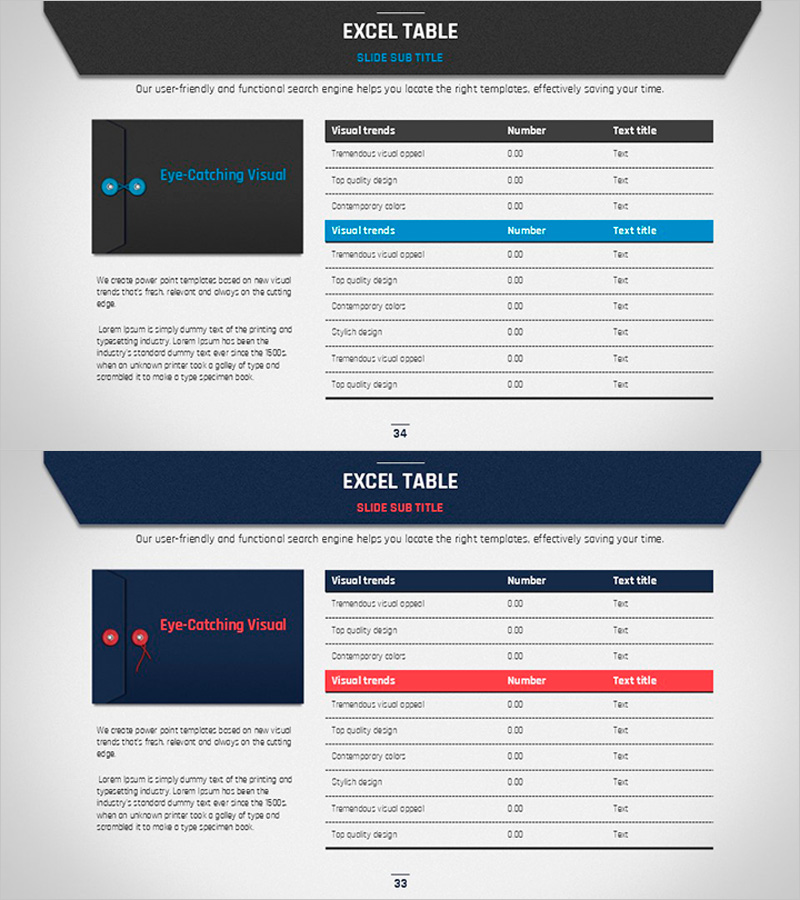
A professional Excel-style table PowerPoint slide designed for business planning and financial analysis presentations. The slide features a dark gray and navy background with white text and blue accent headers, optimizing data readability and visual hierarchy. The three-column structure (Visual trends, Number, Text title) with multiple rows enables simultaneous display of numerical data, descriptions, and titles, making it ideal for cash flow statements, financial forecasts, cost analysis, and budget comparisons. Two slide variations with color options (dark gray and navy) are included, formatted in 16:9 widescreen for compatibility with modern projectors and displays.
Usage Points
-
Main Usage
This table slide is designed to systematically organize and compare numerical data and descriptions in business presentations. It specializes in financial analysis, cash flow forecasting, cost item comparison, and performance metric visualization, providing credible data representation through an Excel-style table structure that enhances audience confidence in quantitative information.
-
How to Use
Insert this slide into the financial section of business plans, investor pitch decks, and financial reports. Enter item names, numerical values, and descriptions in each row, and customize header colors (blue or red) to distinguish between different sections. Utilize both slide variations to maintain consistent document tone while adding visual variety across pages.
-
Recommended For
Recommended for CFOs, financial managers, business strategists, management consultants, and executives who base decisions on quantitative data. Particularly effective for investor presentations, executive management reports, and strategic planning meetings where clear communication of financial status, forecasts, and comparative analysis is essential.
-
Slide Structure
Two-slide set with 3-column table structure (Visual trends × Number × Text title) and multiple data rows. Headers feature dark gray or navy background with white text, while data rows use light gray background for clear row separation. Blue and red accent header options enable section differentiation. Provided in 16:9 widescreen format for optimal display compatibility.
Related Products
-

Triangular Pattern Presentation Table - Financial Plans and Performance
#Financial Plans and Performance #Diagram #Balance Sheet
-

Slide Visualizing Financial Plans with Diagonal Box and Table
#Financial Plans and Performance #Diagram #Balance Sheet
-

Circular Gradient Table – Financial Performance and Differentiation
#Financial Plans and Performance #Diagram #Balance Sheet
-

Data Analysis Table – Visualization of Financial Planning and Performance
#Financial Plans and Performance #Diagram #Balance Sheet
