Geometric Pattern Wide PPT Donut Chart – Business Introduction
RJ0200061_5
- Last Update 04/16/2025
- File Size 0.5MB
- # of Slides 2
- File Format PPTX
- Slide Ratio 16:9
- Color
Keywords
- #Content-Based Slides
- #Design-Based Slides
- #Company Introduction
- #Business Introduction
- #Graph
- #Key Achievements
- #Technological Status
- #Circles
- #Doughnut Chart
- #16:9
- #donut chart PowerPoint
- #pie chart slide template
- #2-segment circular graph
- #ratio comparison PPT slide
- #donut diagram PowerPoint
- #geometric pattern chart slide
About the Product
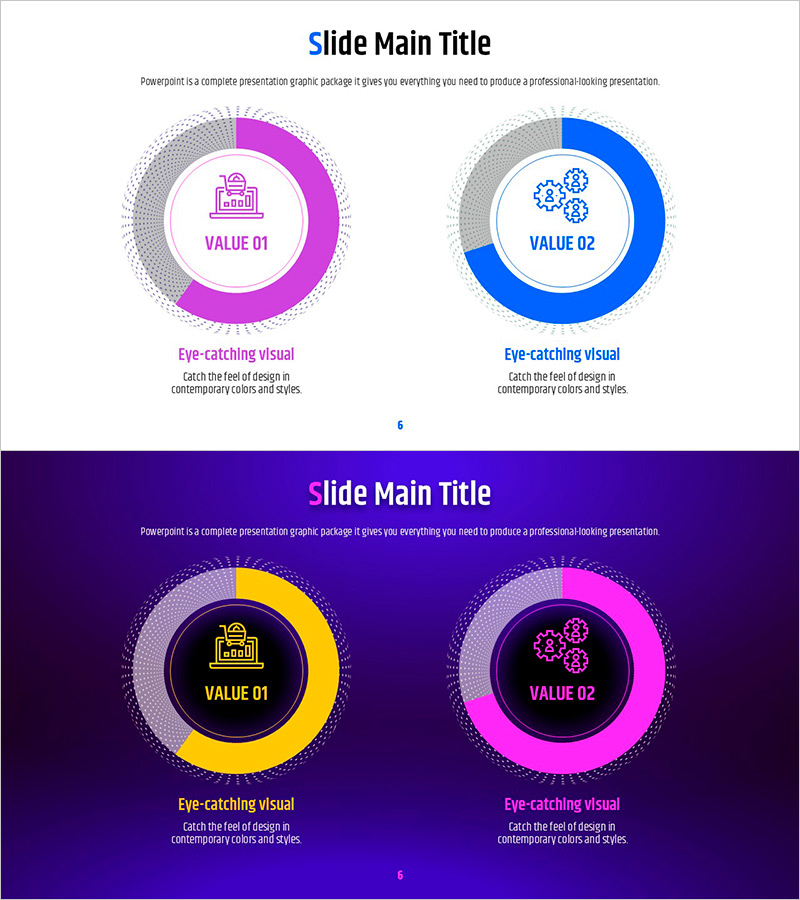
A 2-segment donut chart PowerPoint slide with geometric pattern background in magenta and blue tones. This circular graph design is optimized for ratio comparison and composition visualization, featuring icons and text labels for each section to highlight two key business values, features, or marketing points. The slide set includes 2 slides in 16:9 widescreen format, fully editable in PPTX. Geometric dot patterns create visual depth, with both light and dark background versions to suit various presentation contexts. Perfect for business introductions, value propositions, and component breakdowns in corporate presentations.
Usage Points
-
Main Usage
Donut charts effectively visualize the proportion of parts relative to the whole. This slide emphasizes two key values, features, or marketing points, or illustrates the composition ratio of business components. The geometric pattern background adds visual weight to data representation, while icons and text labels clearly convey the meaning of each segment.
-
How to Use
Use in company profile, business plan, or marketing strategy presentations to highlight core values, business composition, or market share. The light background version suits standard presentations, while the dark version works well for evening events or premium-tone presentations. Directly edit text and numbers to customize data according to your needs.
-
Recommended For
Recommended for business strategists, marketing managers, executives preparing reports, investment pitch presenters, and product introduction specialists. Suitable for all business presentations requiring clear ratio-based data communication.
-
Slide Structure
2-slide set with side-by-side donut chart layout for simultaneous comparison of two items. Each donut is 2-segment divided in magenta and blue, with centered icons and bottom-aligned labels. Geometric dot patterns applied across background for visual cohesion. 16:9 aspect ratio, fully customizable elements.
Related Products
-

Simple & Modern PPT Slide with Donut Chart
#Company Introduction #Business Introduction #Graph
-

Academic Ability Donut Chart – Visual Performance Analysis
#Company Introduction #Business Introduction #Graph
-

Rainbow Presentation Template Doughnut Chart – Start Your Unique Analysis
#Company Introduction #Market and Competitor Analysis #Graph
-

Square Frame Template Pie Chart – Elegance in Data Visualization
#Company Introduction #Product/Service Introduction #Graph
