Simple & Modern PPT Slide with Donut Chart
RJ0200058_6
- Last Update 04/15/2025
- File Size 0.2MB
- # of Slides 2
- File Format PPTX
- Slide Ratio 16:9
- Color
Keywords
About the Product
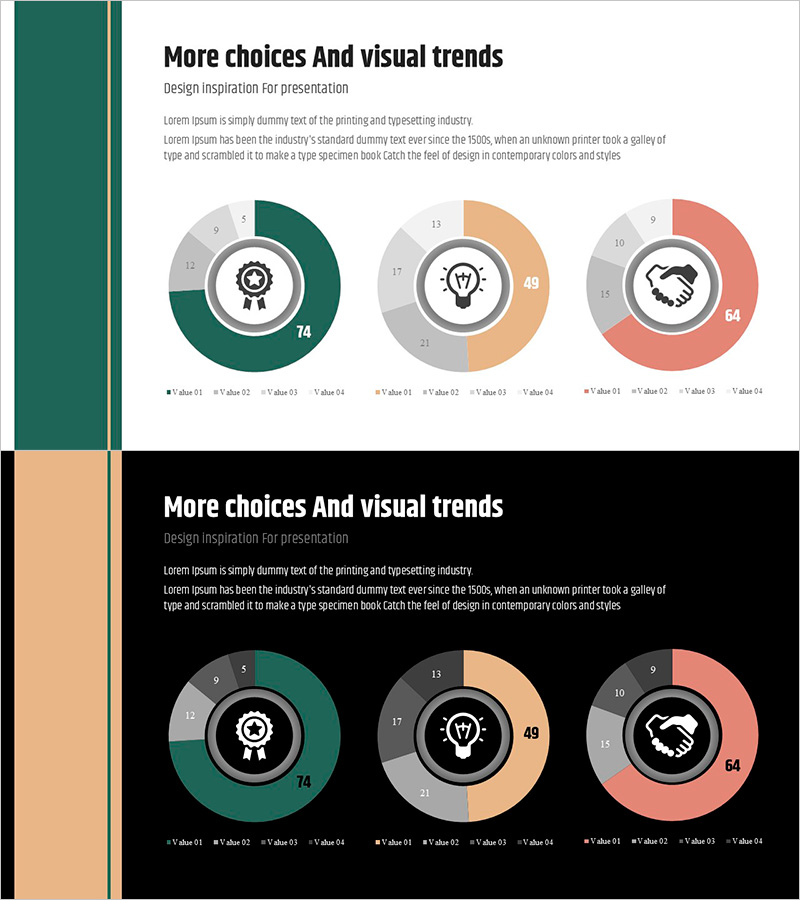
A 2-slide PowerPoint presentation featuring three donut charts for visualizing proportional data across three categories. The design uses a teal-beige-coral color palette with centered icons (award, lightbulb, handshake) to reinforce category meaning. Each chart displays data segments with clear numerical labels, making it ideal for performance analysis, market share, budget allocation, and comparative reporting. The 16:9 widescreen PPTX format is fully editable and ready for immediate use in presentations, reports, and proposals.
Usage Points
-
Main Usage
Visualizes the composition ratio, market share, or distribution of three data categories using donut charts. Ideal for presenting performance metrics, market share breakdown, budget allocation, customer segmentation, product sales distribution, and comparative analysis in a clear, visually engaging format.
-
How to Use
Insert your numerical data into the donut charts in the analysis or results section of your presentation. Edit the chart values, adjust colors to match your brand, and customize the center icons to reflect your data categories. Use as a summary page in reports, proposals, and business presentations to enhance audience comprehension.
-
Recommended For
Marketing professionals, financial analysts, project managers, and business executives presenting data-driven insights. Suitable for quarterly performance reviews, market research presentations, budget status reports, customer segmentation analysis, and any presentation requiring proportional data visualization.
-
Slide Structure
2-slide layout with three donut charts arranged horizontally on each slide. Each chart displays three data segments color-coded for easy distinction, with centered icons (award, lightbulb, handshake) representing category meaning. Optimized for 16:9 widescreen display and large-screen presentations.
Related Products
-

Academic Ability Donut Chart – Visual Performance Analysis
#Company Introduction #Business Introduction #Graph
-

Geometric Pattern Wide PPT Donut Chart – Business Introduction
#Company Introduction #Business Introduction #Graph
-

Donut Charts in 4 Fields – Effective Performance Visualization
#Company Introduction #Product/Service Introduction #Graph
-

Visualizing Key Achievements with Donut Chart Slide – Company and Product/Service Introduction
#Company Introduction #Product/Service Introduction #Diagram
