Academic Ability Donut Chart – Visual Performance Analysis
RJ0500025_5
- Last Update 06/13/2025
- File Size 0.4MB
- # of Slides 2
- File Format PPTX
- Slide Ratio 16:9
- Color
Keywords
- #Content-Based Slides
- #Design-Based Slides
- #Company Introduction
- #Business Introduction
- #Graph
- #Key Achievements
- #Technological Status
- #Circles
- #Doughnut Chart
- #16:9
- #donut chart PowerPoint
- #pie chart slide template
- #performance analysis presentation
- #4-item ratio chart
- #circular graph PowerPoint slide
- #how to create donut chart in PowerPoint
About the Product
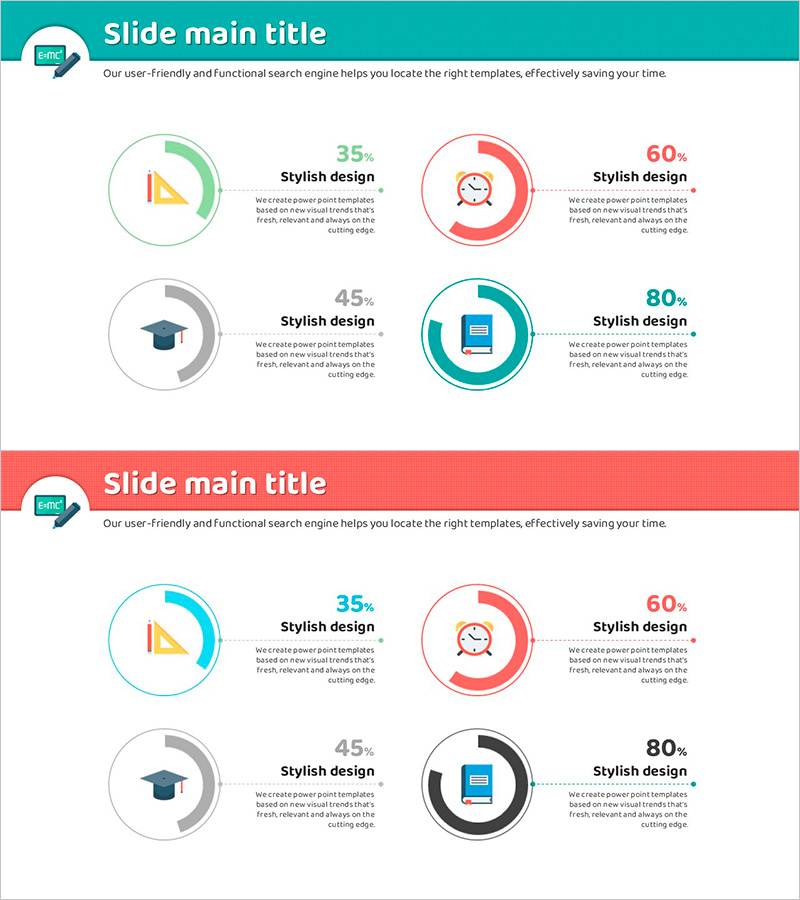
A 4-item donut chart PowerPoint slide designed to visualize academic ability, performance metrics, and competency assessment. The circular graphs feature turquoise, red, and gray color schemes with central icons (triangle, clock, graduation cap, computer) to clearly distinguish each category. This 2-slide set enables quick data entry and immediate presentation use. The donut format makes percentage comparisons intuitive and visually engaging for educational and professional audiences.
Usage Points
-
Main Usage
Display academic achievement, skill assessment, and ability comparison using circular graphs that allow audiences to instantly grasp the relative proportion of each metric. Ideal for educational institutions, learning evaluations, and personal competency presentations.
-
How to Use
Replace the sample percentage values with your actual performance data, customize colors and icons as needed, and insert the slides into your presentation. Use both slides consecutively or select individual slides based on your presentation flow.
-
Recommended For
Educators, students presenting portfolios, HR professionals conducting competency reviews, educational consultants, learning management system (LMS) administrators, academic advisors, and training specialists preparing performance analysis presentations.
-
Slide Structure
Slide 1: Turquoise header + 4 donut charts (35%, 60%, 45%, 80% ratios) + central icons + text labels. Slide 2: Red header variant with identical donut chart structure. 16:9 widescreen format, 2 slides in PPTX.
Related Products
-

Simple & Modern PPT Slide with Donut Chart
#Company Introduction #Business Introduction #Graph
-

Geometric Pattern Wide PPT Donut Chart – Business Introduction
#Company Introduction #Business Introduction #Graph
-

Visualizing Key Achievements with Donut Chart Slide – Company and Product/Service Introduction
#Company Introduction #Product/Service Introduction #Diagram
-

Donut Charts in 4 Fields – Effective Performance Visualization
#Company Introduction #Product/Service Introduction #Graph
