Geometric Pattern Wide PowerPoint Line Chart – Business Performance Analysis
RJ0200061_11
- Last Update 04/16/2025
- File Size 3.1MB
- # of Slides 2
- File Format PPTX
- Slide Ratio 16:9
- Color
Keywords
- #Content-Based Slides
- #Design-Based Slides
- #Business Strategy
- #Financial Plans and Performance
- #Graph
- #Achievements
- #Sales and Revenue
- #Line
- #Line Chart
- #16:9
- #line chart PowerPoint slide
- #dual-series trend analysis
- #annual performance graph
- #how to create line chart in PowerPoint
- #business analytics slide template
About the Product
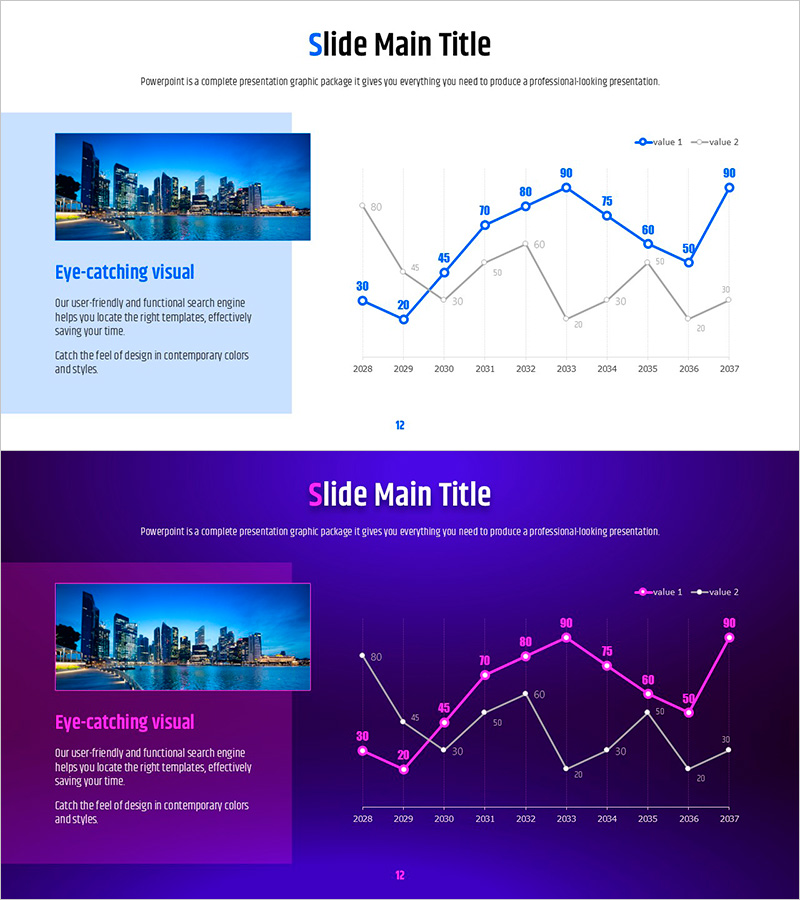
A professional line chart PowerPoint slide visualizing two data series from 2008 to 2037 with clear trend analysis. The slide features a light blue background with blue and gray line series, each data point labeled with numerical values for precise comparison. A cityscape image is positioned on the left with 'Eye-catching visual' text, creating visual balance and engagement. This slide template is ready to use for business performance reports, financial analysis, market trends, and year-over-year comparisons in executive presentations.
Usage Points
-
Main Usage
Effectively compare two metrics or data series over time, such as revenue trends, market share evolution, customer satisfaction scores, or operational KPIs. The dual-line format enables side-by-side analysis and helps audiences quickly identify performance patterns and correlations.
-
How to Use
Replace the blue and gray data series with your actual figures by editing the chart values. Update the left-side image with your company photo and modify the text box content to highlight key insights or conclusions from your data analysis.
-
Recommended For
Executive dashboards, quarterly earnings reports, investor presentations, marketing performance reviews, financial forecasts, and strategic planning sessions. Ideal for managers, analysts, consultants, and business leaders presenting data-driven insights.
-
Slide Structure
Dual-line graph with approximately 10 data points per series (2008–2037), legend indicators, left-side image area (cityscape photo), and text annotation box. Optimized for 16:9 widescreen format with balanced composition.
Related Products
-

Highlighting Key Data Points in Trends – Performance and Vision
#Business Strategy #Financial Plans and Performance #Graph
-

Red Green Line Chart – Sales and Performance Analysis
#Business Strategy #Financial Plans and Performance #Graph
-

Kids Drawing Line Graph – Emphasizing Performance
#Business Strategy #Financial Plans and Performance #Graph
-

Key Performance Graphs – Business Strategy and Performance
#Business Strategy #Financial Plans and Performance #Graph
