Kids Drawing Line Graph – Emphasizing Performance
RJ0500027_11
- Last Update 06/14/2025
- File Size 1.7MB
- # of Slides 2
- File Format PPTX
- Slide Ratio 16:9
- Color
Keywords
About the Product
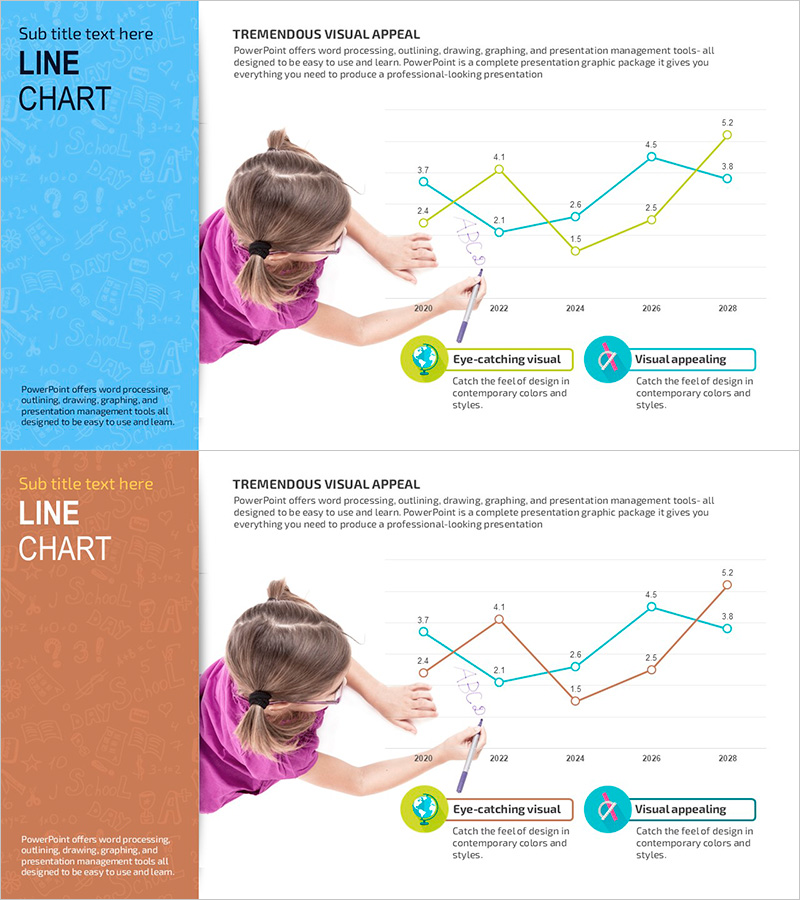
A child-friendly line chart PowerPoint slide featuring two data series in blue and orange backgrounds. This presentation template visualizes performance trends from 2020 to 2028 with a playful, hand-drawn illustration style. Each slide includes icon badges and descriptive text boxes, making it ready for immediate use in sales reports, financial planning presentations, and performance summaries. Provided in 16:9 PPTX format with clearly defined data input areas for easy customization and professional-looking results.
Usage Points
-
Main Usage
Ideal for comparing two data series over time, such as sales trends, performance metrics, or financial indicators. The playful kids drawing style creates an approachable, engaging presentation suitable for educational presentations, youth program reports, and family-oriented audiences.
-
How to Use
Input your actual data into the designated fields on each slide, and the chart automatically updates. Customize the blue and orange color series as needed, and use the icon badges and text boxes to highlight key messages and insights from your data.
-
Recommended For
Educators, youth program managers, performance analysts, financial professionals, and marketing specialists who need to present trend data in an accessible, visually engaging format. Particularly effective when targeting younger audiences or when a friendly, approachable tone is desired.
-
Slide Structure
Two-slide set with left-side colored background panels (blue and orange) and right-side line chart areas. Each chart displays two data series (blue and orange lines), four time intervals (2020, 2022, 2024, 2026, 2028), five data points per series, and bottom-positioned icon badges with accompanying text boxes for annotations.
Related Products
-

Highlighting Key Data Points in Trends – Performance and Vision
#Business Strategy #Financial Plans and Performance #Graph
-

Performance Analysis Visualization with Line Graph – Challenge and Success
#Business Strategy #Financial Plans and Performance #Graph
-

Key Performance Graphs – Business Strategy and Performance
#Business Strategy #Financial Plans and Performance #Graph
-

Visualize Performance with Line Graph Trends – Business Strategy
#Business Strategy #Financial Plans and Performance #Graph
