Highlighting Key Data Points in Trends – Performance and Vision
RB0800068_6
- Last Update 03/27/2025
- File Size 0.7MB
- # of Slides 2
- File Format PPTX
- Slide Ratio 4:3
- Color
Keywords
About the Product
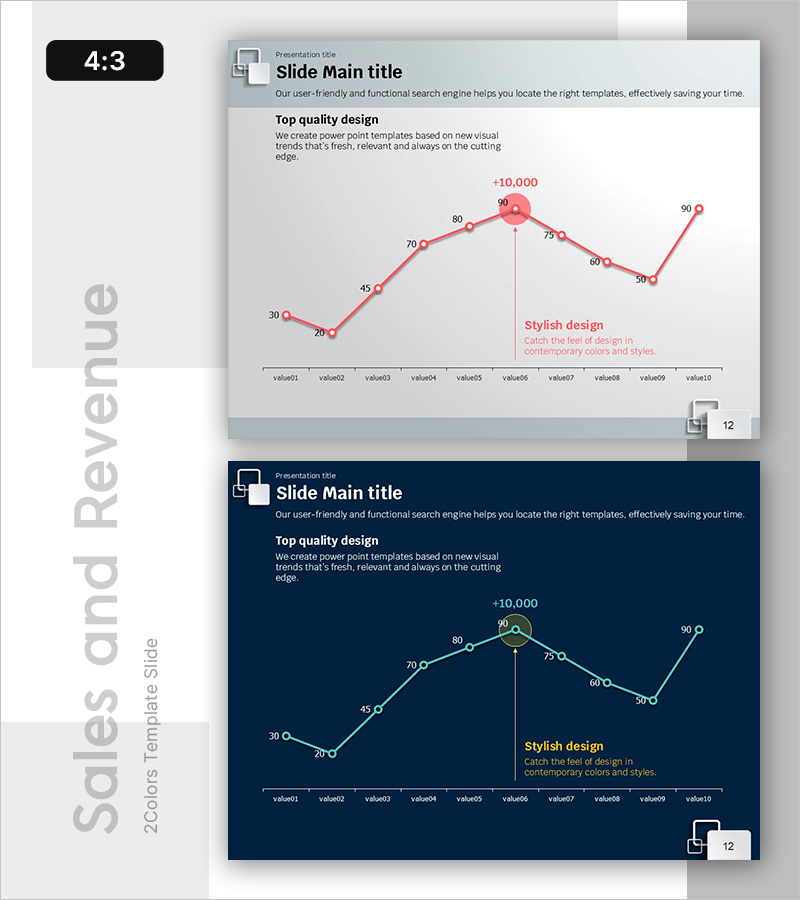
A line chart PowerPoint slide that visualizes key performance metrics and strategic vision through trend analysis. The slide features 10 connected data points forming a dynamic trend line that clearly shows changes over time. Pink circular nodes and a vertical reference line emphasize the peak value, while the +10,000 label at the top conveys growth magnitude intuitively. This presentation slide is ready to use in financial reports, business performance presentations, and marketing analysis decks. The 4:3 aspect ratio with 2-slide layout adapts to various presentation environments.
Usage Points
-
Main Usage
Express numerical changes and growth trends over time using a line chart to effectively communicate performance indicators, revenue trends, customer growth rates, and other dynamic data. The peak value highlight feature emphasizes critical performance milestones.
-
How to Use
Apply to revenue and profit trend sections in financial reports, KPI analysis in business performance presentations, campaign effectiveness analysis in marketing plans, and growth curve representation in investor pitch decks. Edit data values directly to reflect actual figures.
-
Recommended For
Recommended for CFOs and finance managers presenting quarterly performance reports, marketing managers analyzing campaign effectiveness, executives preparing strategy meeting materials, investor presentations and pitch decks, and consultants delivering client analysis reports.
-
Slide Structure
2-slide layout. First slide features a light gray background with pink line chart (10 nodes with vertical reference line). Second slide uses dark blue background with identical chart structure, allowing selection based on presentation context. 4:3 aspect ratio.
Related Products
-

Key Performance Graphs – Business Strategy and Performance
#Business Strategy #Financial Plans and Performance #Graph
-

Kids Drawing Line Graph – Emphasizing Performance
#Business Strategy #Financial Plans and Performance #Graph
-

Visualizing Annual Sales Performance Trends - Graph Slide
#Business Strategy #Financial Plans and Performance #Graph
-

Visualize Performance with Line Graph Trends – Business Strategy
#Business Strategy #Financial Plans and Performance #Graph
