Stacked Bar Graph by Year with Detailed Breakdown - Market Analysis Insights
RB0800038_5
- Last Update 03/25/2025
- File Size 2.4MB
- # of Slides 2
- File Format PPTX
- Slide Ratio 4:3
- Color
Keywords
- #Content-Based Slides
- #Design-Based Slides
- #Market and Competitor Analysis
- #Financial Plans and Performance
- #Graph
- #Industry Trends
- #Sales and Revenue
- #Horizontal Bar
- #Segmented Horizontal Bar
- #4:3
- #stacked bar chart PowerPoint
- #horizontal bar graph template
- #year-over-year data visualization
- #market analysis slide
- #financial performance chart
- #multi-series bar chart download
About the Product
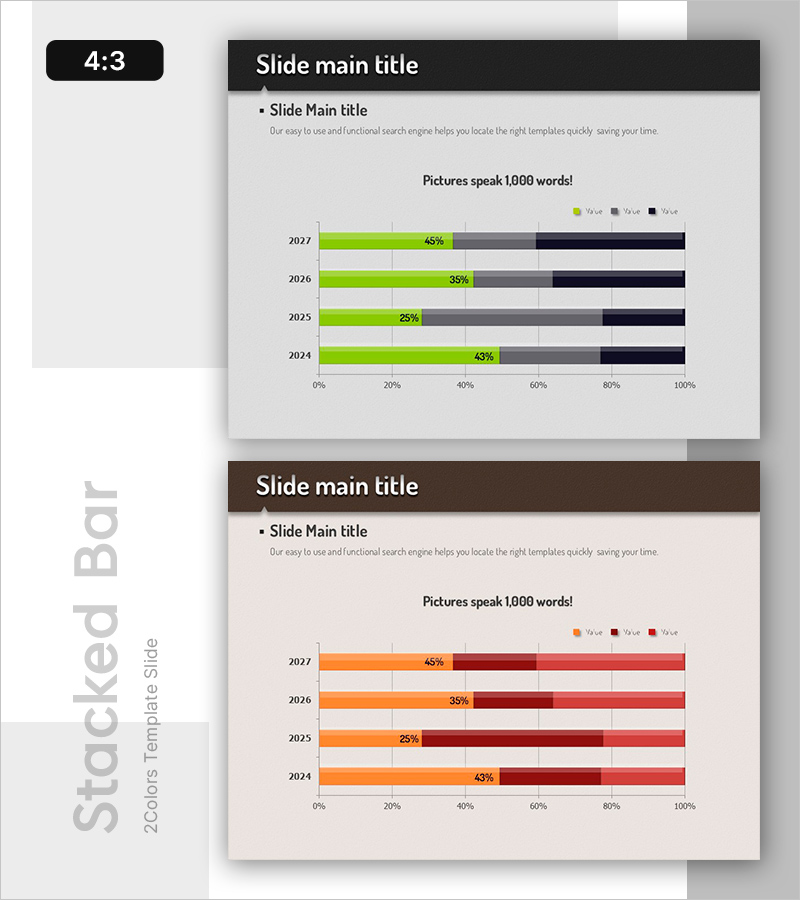
A horizontal stacked bar chart PowerPoint slide that visualizes year-over-year data segmented into three distinct series from 2027 to 2024. This presentation template uses a lime-gray-navy color palette to clearly differentiate each component, with percentage values displayed directly on each bar segment. Ideal for business reports, marketing plans, and investor presentations, this slide enables quick comparison of market trends, revenue composition, and financial performance across multiple years. The chart structure supports immediate editing and integration into your presentation deck.
Usage Points
-
Main Usage
Visualizes complex year-over-year data by breaking down each year into three component series with percentage values. Enables clear comparison of compositional changes across time periods, making it ideal for presenting market share evolution, revenue mix shifts, or cost allocation trends.
-
How to Use
Insert into business reports' market analysis sections, marketing strategy presentations, investor pitch decks, or executive dashboards. Replace the sample data with your own figures while maintaining the three-series structure. The percentage labels update automatically when you modify the underlying values.
-
Recommended For
Financial analysts, marketing strategists, business development managers, and executives presenting performance metrics. Particularly effective for annual reviews, quarterly comparisons, market segmentation reports, and investor communications requiring multi-year trend analysis.
-
Slide Structure
Two-slide set. First slide features lime-gray-navy stacked bars for years 2027–2024 with percentage labels. Second slide presents the same layout in orange-wine-pink color scheme. Both include horizontal gridlines (0–100%), legend, and editable data fields for seamless customization.
Related Products
-

Comparison of Fruit Consumption – Market Trend Analysis
#Market and Competitor Analysis #Financial Plans and Performance #Graph
-

Market Trends Visualized with Stacked Graph – Sales Performance and Competitive Analysis
#Market and Competitor Analysis #Financial Plans and Performance #Graph
-

Sales Outlook Analysis Segmented Graph – Visualizing Financial Performance
#Financial Plans and Performance #Diagram #Graph
-

Road Bar Chart for Transportation Utilization
#Market and Competitor Analysis #Graph #Industry Trends
