Horizontal Bar Chart Slide | Data Comparison & Analysis PPT
RJ0600098_21
- Last Update 07/17/2025
- File Size 3MB
- # of Slides 2
- File Format PPTX
- Slide Ratio 16:9
- Color
Keywords
- #Design-Based Slides
- #Business Strategy
- #Financial Plans and Performance
- #Graph
- #Achievements
- #Sales and Revenue
- #Horizontal Bar
- #Segmented Horizontal Bar
- #16:9
- #horizontal bar chart PowerPoint
- #bar graph slide template
- #data comparison presentation
- #year-over-year performance chart
- #business analytics slide
- #how to create bar chart in PowerPoint
About the Product
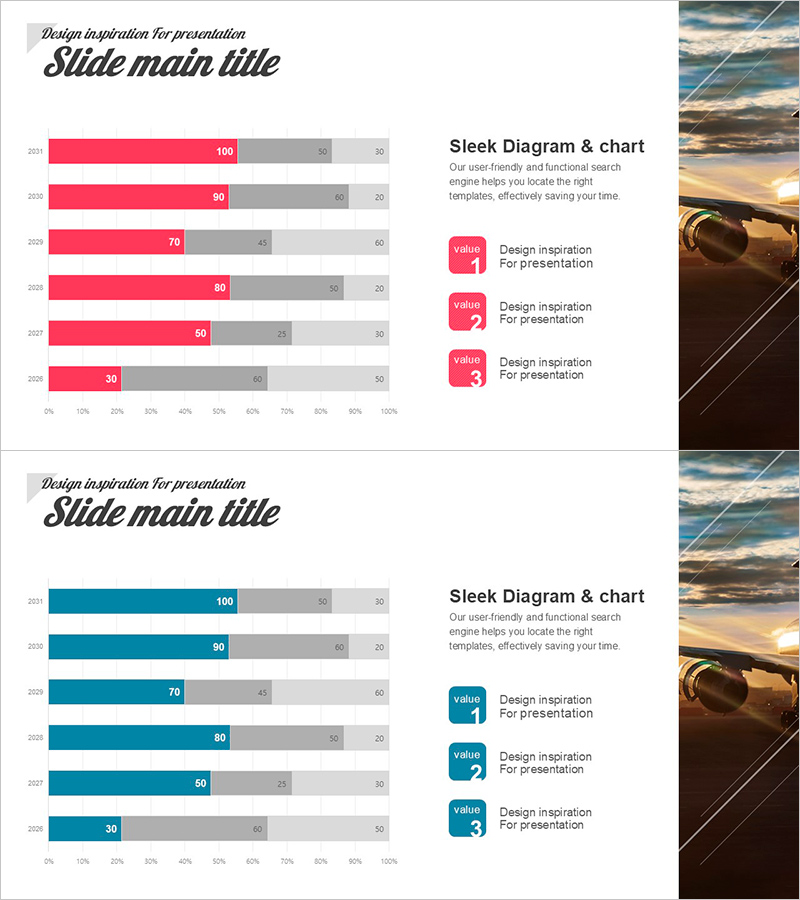
A horizontal bar chart PowerPoint slide designed to compare year-over-year performance data from 2021 to 2026 across three data series. Each year displays three metrics (primary indicator, secondary indicator, reference value) on a 100-point scale, enabling clear performance tracking and ranking analysis. Available in two color versions—pink and blue—this slide includes three value callout boxes on the right side for highlighting key insights and conclusions. Ideal for sales reports, financial analysis, market share presentations, and executive briefings where quantitative data visualization is essential.
Usage Points
-
Main Usage
Displays quantitative data across multiple years or categories using horizontal bars, making performance trends and rankings immediately visible. The 100-point scale clearly communicates achievement rates, market share, and comparative metrics, while the three-series structure supports complex multi-dimensional analysis and competitive benchmarking.
-
How to Use
Insert into financial reports, quarterly business reviews, investor presentations, and team meetings to compare sales figures, customer satisfaction scores, market penetration rates, or departmental performance. The three value callout boxes on the right allow you to add key findings, strategic implications, or recommended actions, transforming raw data into actionable insights for executives and stakeholders.
-
Recommended For
Finance directors, sales managers, marketing strategists, and business analysts presenting performance metrics to executives, investors, or clients. Essential for business plans, annual reports, marketing proposals, pitch decks, and investor relations materials where data-driven decision-making and transparent performance communication are critical.
-
Slide Structure
Two-slide set featuring six horizontal bars representing years 2021–2026, each displaying three data series with labeled values on a 0–100% scale. Right-aligned value callout boxes (pink and blue versions) provide space for annotations and key messages. 16:9 widescreen format ensures compatibility with modern presentation systems and large-screen displays.
Related Products
-

Total Chart by Donation Type – Visualizing Financial Performance
#Business Strategy #Financial Plans and Performance #Graph
-

Horizontal Segmentation Bar Graph for Business Performance Analysis – Innovative Strategy
#Business Strategy #Financial Plans and Performance #Diagram
-

Geometric Pattern Wide PowerPoint Line Chart – Business Performance Analysis
#Business Strategy #Financial Plans and Performance #Graph
-

AI Investment KPI Slide – Dark Diamond Cards PowerPoint
#Business Strategy #Financial Plans and Performance #Achievements
