Gradient Table Presentation for Visualizing Financial Performance
RJ0200060_13
- Last Update 04/16/2025
- File Size 0.1MB
- # of Slides 2
- File Format PPTX
- Slide Ratio 16:9
- Color
Keywords
- #Content-Based Slides
- #Design-Based Slides
- #Financial Plans and Performance
- #Diagram
- #Balance Sheet
- #Key Financial Indicators
- #Table
- #16:9
- #financial data table PowerPoint slide
- #financial metrics presentation
- #performance report table slide
- #how to create financial tables in PowerPoint
- #data visualization table
About the Product
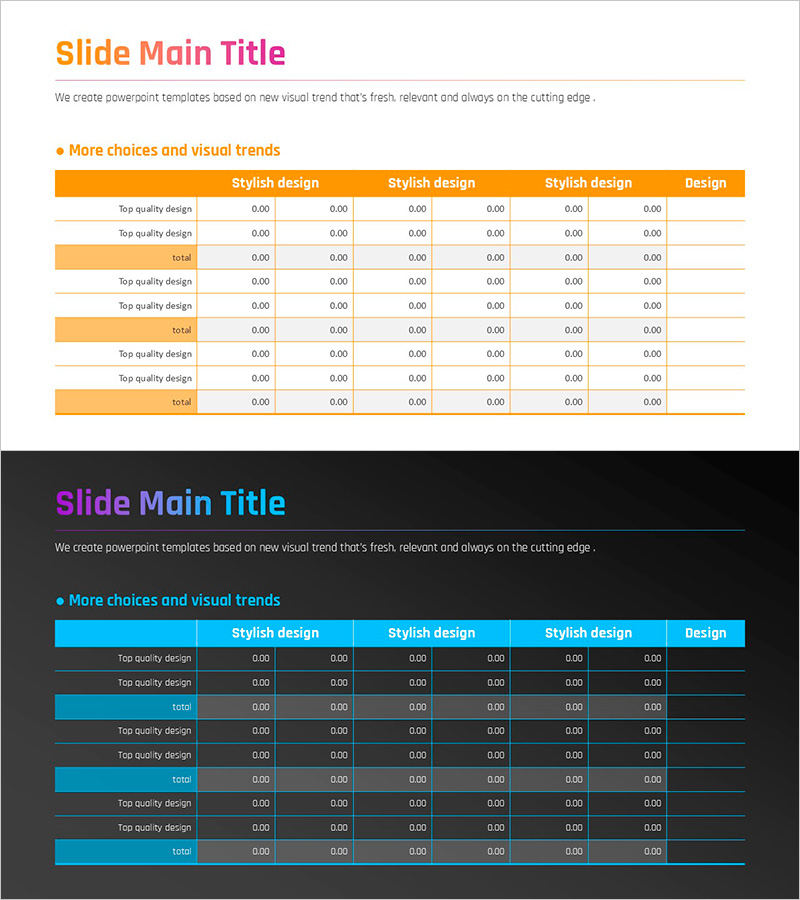
A professional PowerPoint slide designed to clearly visualize financial performance and numerical data. The orange gradient header contrasts with a white background to maximize data readability and visual impact. The 2-slide set allows you to input various financial metrics such as revenue, expenses, and profit margins in table format, with easy row categorization and numerical comparison. Immediately applicable for investor reports, financial analysis presentations, and quarterly performance reviews.
Usage Points
-
Main Usage
Clearly communicate financial indicators, revenue status, cost analysis, and profit margins using table format. The orange header color visually emphasizes key information, while row dividers clarify data hierarchy and improve readability for stakeholders.
-
How to Use
Enter financial item names (revenue, cost of goods sold, operating profit, etc.) in each row's text field, then input corresponding numerical values column by column. Compare quarterly or annual data, or display performance across departments and business units. Modify colors to highlight specific rows for emphasis.
-
Recommended For
CFOs, financial managers, investor relations teams, and executives responsible for quarterly earnings presentations, annual financial reports, investor briefings, and internal management meetings. Particularly effective when data-driven decision-making and numerical credibility are essential.
-
Slide Structure
2-slide set with one title input area and one multi-row, multi-column table per slide. Each table features an orange gradient header row plus 5-6 data rows, with cells that accommodate both text and numerical values for flexible data entry.
Related Products
-

Balance Sheet Table Slide – Foundation for Financial Planning
#Financial Plans and Performance #Diagram #Balance Sheet
-

Checklist Table Slide for Financial Planning
#Financial Plans and Performance #Diagram #Balance Sheet
-

Construction Business Balance Sheet - The Start of Clear Financial Management
#Financial Plans and Performance #Diagram #Balance Sheet
-

Analysis Table of Korean Culture – An Effective Data Visualization Tool
#Financial Plans and Performance #Diagram #Balance Sheet
