Sleek Diagram and Chart Design
RJ0200052_26
- Last Update 04/13/2025
- File Size 0.4MB
- # of Slides 2
- File Format PPTX
- Slide Ratio 16:9
- Color
Keywords
About the Product
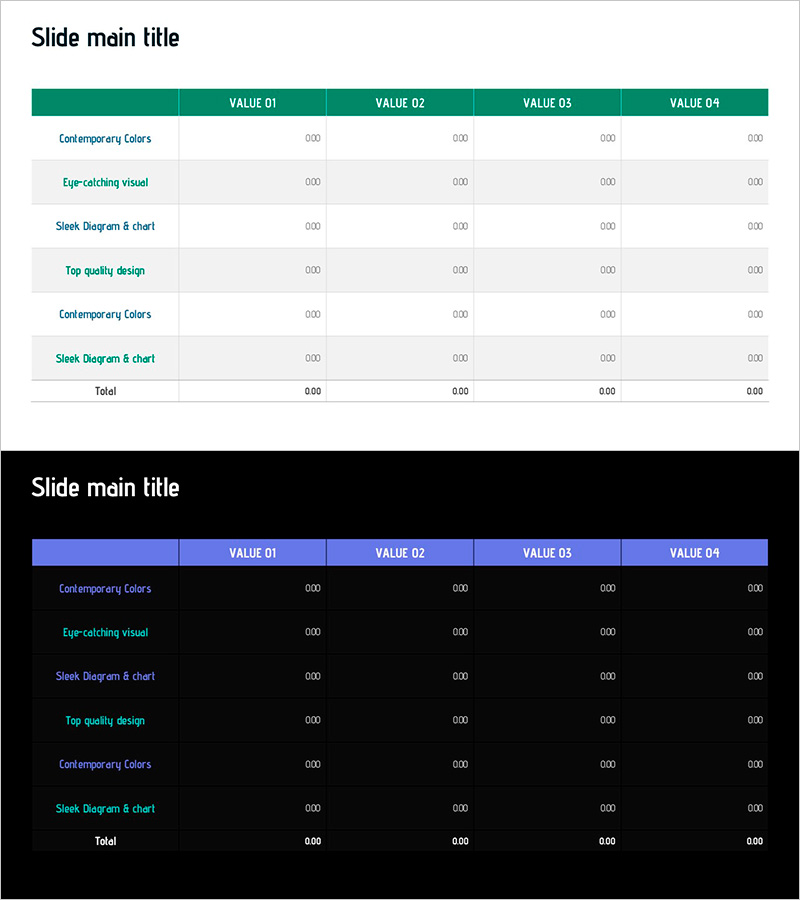
An essential data table PowerPoint slide for business presentations and reports. This slide features a teal-colored header with white background, creating clear contrast for maximum information readability. The table structure with 4 columns and 6 rows is optimized for comparing items and organizing performance metrics. A dark background version is also included, allowing you to choose the design that matches your presentation context and document tone. The 2-slide set supports various data visualization approaches and is fully compatible with modern 16:9 widescreen presentation environments. Provided in editable PPTX format, enabling quick data input and customization.
Usage Points
-
Main Usage
Clearly compare and organize quantitative data and performance metrics. Ideal for presenting sales figures, departmental performance, product specifications, market analysis numbers, and other business data in a structured table format.
-
How to Use
Enter your numbers and text directly into the table cells. Use the teal header version for light-background presentations and the dark version for dark backgrounds or video recording. Rows and columns can be added or removed as needed.
-
Recommended For
Financial reports, quarterly performance presentations, market research results, product specification comparisons, organizational data sharing meetings, investor pitch decks, and executive briefings. Recommended for planners, analysts, finance professionals, and marketing managers.
-
Slide Structure
2-slide set featuring a light table with teal header and light gray row backgrounds on the first slide, and a high-contrast table with blue header and dark background on the second. Each table contains 4 columns (VALUE 01–04), 6 data rows, and a total row, with clear color separation between header and data areas for visual hierarchy.
Related Products
-

Visualizing Financial Performance with Standard Table Slide
#Financial Plans and Performance #Diagram #Balance Sheet
-

Triangle Pattern PPT Table Chart – Visualizing Financial Performance
#Financial Plans and Performance #Diagram #Balance Sheet
-

Analysis Table of Korean Culture – An Effective Data Visualization Tool
#Financial Plans and Performance #Diagram #Balance Sheet
-

Modern Blue Table Chart Presentation Template
#Financial Plans and Performance #Diagram #Balance Sheet
