Checklist Table Slide for Financial Planning
RM0500009_26
- Last Update 02/22/2025
- File Size 0.5MB
- # of Slides 2
- File Format PPTX
- Slide Ratio 16:9
- Color
Keywords
About the Product
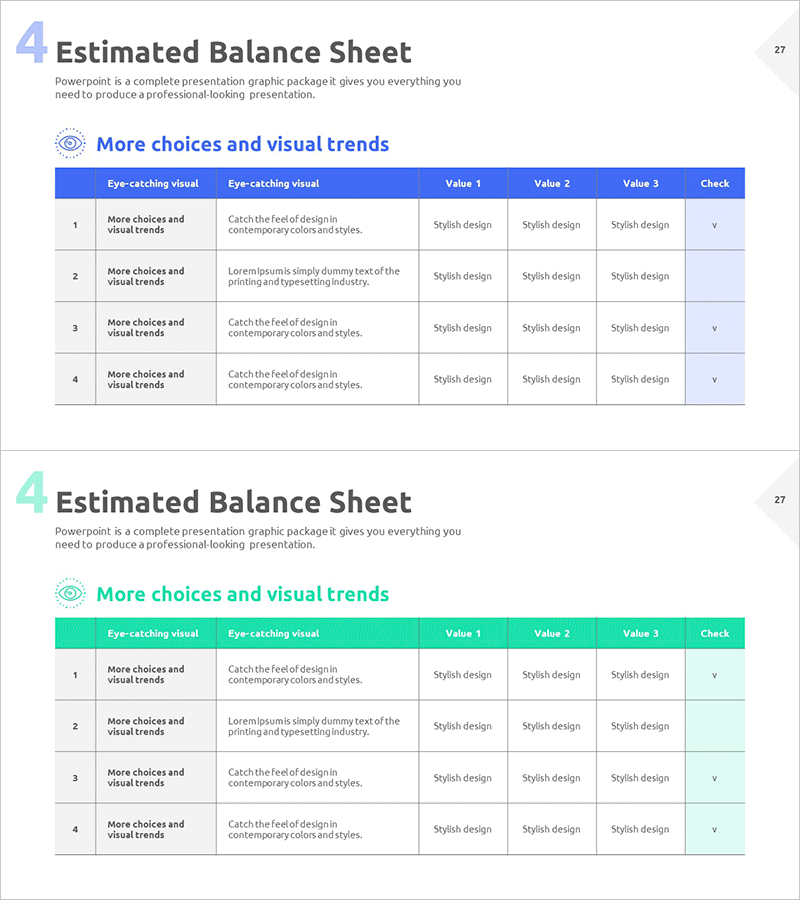
A professional checklist table PowerPoint slide designed for financial planning and budget management. This 2-slide set features a blue header and light gray row backgrounds, ideal for reviewing financial metrics, balance sheet items, budget approval processes, and financial verification tasks. Each row includes columns for item description, three data input fields, and a check column, enhancing readability and verification efficiency. Available in 16:9 widescreen PPTX format, it integrates seamlessly into any presentation environment. The clearly defined text and numerical input areas make it perfect for financial reports, investor presentations, and budget review meetings.
Usage Points
-
Main Usage
Serves as a tracking checklist during financial planning to monitor review items and approval status at a glance. Effectively manages verification of financial statements (balance sheet, income statement, cash flow) and monitors achievement of financial metrics for stakeholder reporting.
-
How to Use
Enter review item names in the text fields, input numerical data and status information in the three data columns, and mark completion status in the check column. Insert into the 'Financial Status' section of financial reports or 'Financial Verification' pages of investor materials to convey financial management systems with credibility.
-
Recommended For
Ideal for presentations to CFOs, finance managers, executives, and investors. Particularly effective for quarterly financial review meetings, budget approval processes, investor roadshows, and financial oversight committee reports where financial accuracy and verification processes need emphasis.
-
Slide Structure
Comprises 2 slides, each with a blue header containing 7 columns (number, item name, description, value 1, value 2, value 3, check) and 4 data rows. Clear header-to-row color differentiation creates distinct information hierarchy, while separated text and numerical input areas maximize data entry efficiency.
Related Products
-

Analysis Table of Korean Culture – An Effective Data Visualization Tool
#Financial Plans and Performance #Diagram #Balance Sheet
-

Balance Sheet Chart for Financial Planning Slide
#Financial Plans and Performance #Diagram #Balance Sheet
-

Application Development Business Balance Sheet – Stylish Financial Presentation
#Financial Plans and Performance #Diagram #Other
-

Green Brown Statistics Table – Financial Performance Analysis
#Financial Plans and Performance #Diagram #Balance Sheet
