Balance Sheet Chart for Financial Planning Slide
RM0500005_26
- Last Update 02/21/2025
- File Size 0.2MB
- # of Slides 2
- File Format PPTX
- Slide Ratio 16:9
- Color
Keywords
About the Product
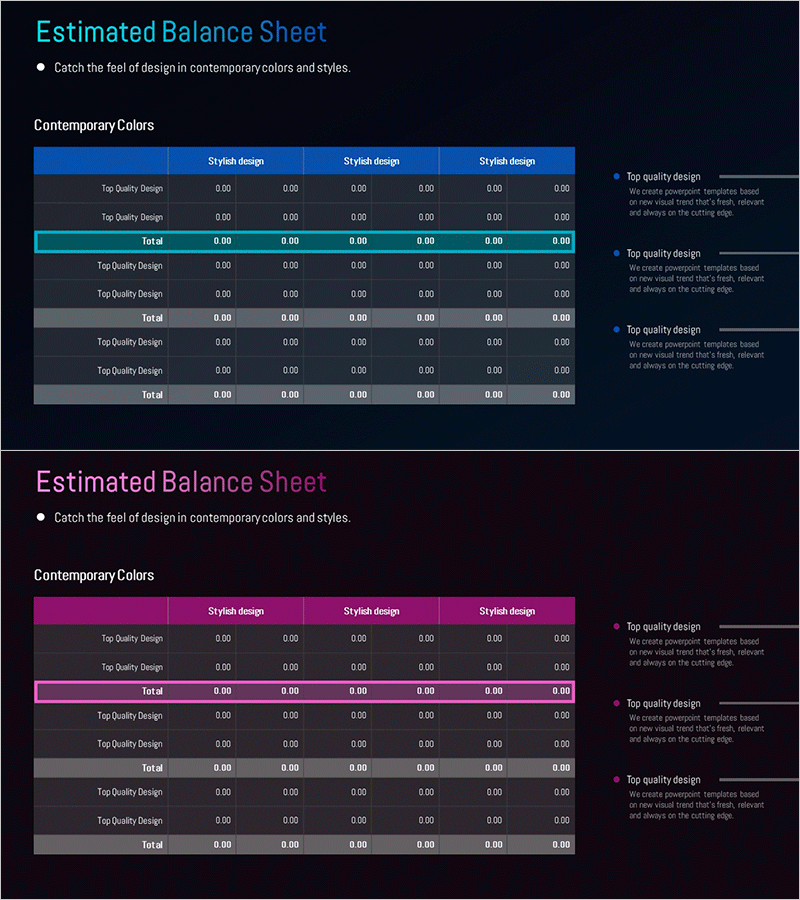
An essential PowerPoint slide for financial planning and investor presentations featuring a professional balance sheet layout. Available in two color themes—dark blue and magenta—allowing you to match your corporate brand identity. Each slide uses a multi-row table structure that clearly separates assets, liabilities, and equity items, presenting numerical data intuitively. The 16:9 widescreen format with 2-slide composition enables side-by-side comparison of current and projected financial positions. Provided in fully editable PPTX format, you can immediately input your actual financial figures and deploy the presentation.
Usage Points
-
Main Usage
Clearly communicate your company's financial position to investors and stakeholders. The structured table format presents assets, liabilities, and equity in an organized manner, enabling viewers to quickly assess financial health and capital structure.
-
How to Use
Use in IR materials, financial reports, and business plan presentations within the financial section. Select either the dark blue or magenta theme matching your corporate colors, then input your actual financial figures. Compare current and projected financial positions side by side.
-
Recommended For
CFOs, finance managers, and investor relations professionals presenting financial status. Ideal for startups demonstrating financial soundness in investment pitch meetings, and suitable for bank, financial institution, and consulting firm financial analysis reports.
-
Slide Structure
Each slide contains one title area and one multi-row, multi-column financial table. The table organizes assets, liabilities, and equity by rows, with period-by-period or category-by-category figures in columns for easy comparative analysis. The 2-slide set allows simultaneous presentation of current and projected positions.
Related Products
-

Construction Business Balance Sheet - The Start of Clear Financial Management
#Financial Plans and Performance #Diagram #Balance Sheet
-

Origami Concept Table – Visualizing Financial Performance
#Financial Plans and Performance #Diagram #Balance Sheet
-

Triangle Pattern PPT Table Chart – Visualizing Financial Performance
#Financial Plans and Performance #Diagram #Balance Sheet
-

Checklist Table Slide for Financial Planning
#Financial Plans and Performance #Diagram #Balance Sheet
