AI VC Market Statistics PowerPoint Slide – Bar Chart and KPI
RM0500013_4
- Last Update 04/23/2026
- File Size 16.3MB
- # of Slides 2
- File Format PPTX
- Slide Ratio 16:9
- Color
Keywords
- #Design-Based Slides
- #Market and Competitor Analysis
- #Financial Plans and Performance
- #Graph
- #Market Status
- #Sales and Revenue
- #Column
- #Column Chart
- #16:9
- #AI VC market statistics PowerPoint slide
- #market analysis bar chart presentation template
- #AI startup investment data slide PowerPoint
- #VC funding market share slide deck
- #market competition statistics PPT
- #AI investment market data KPI slide
About the Product
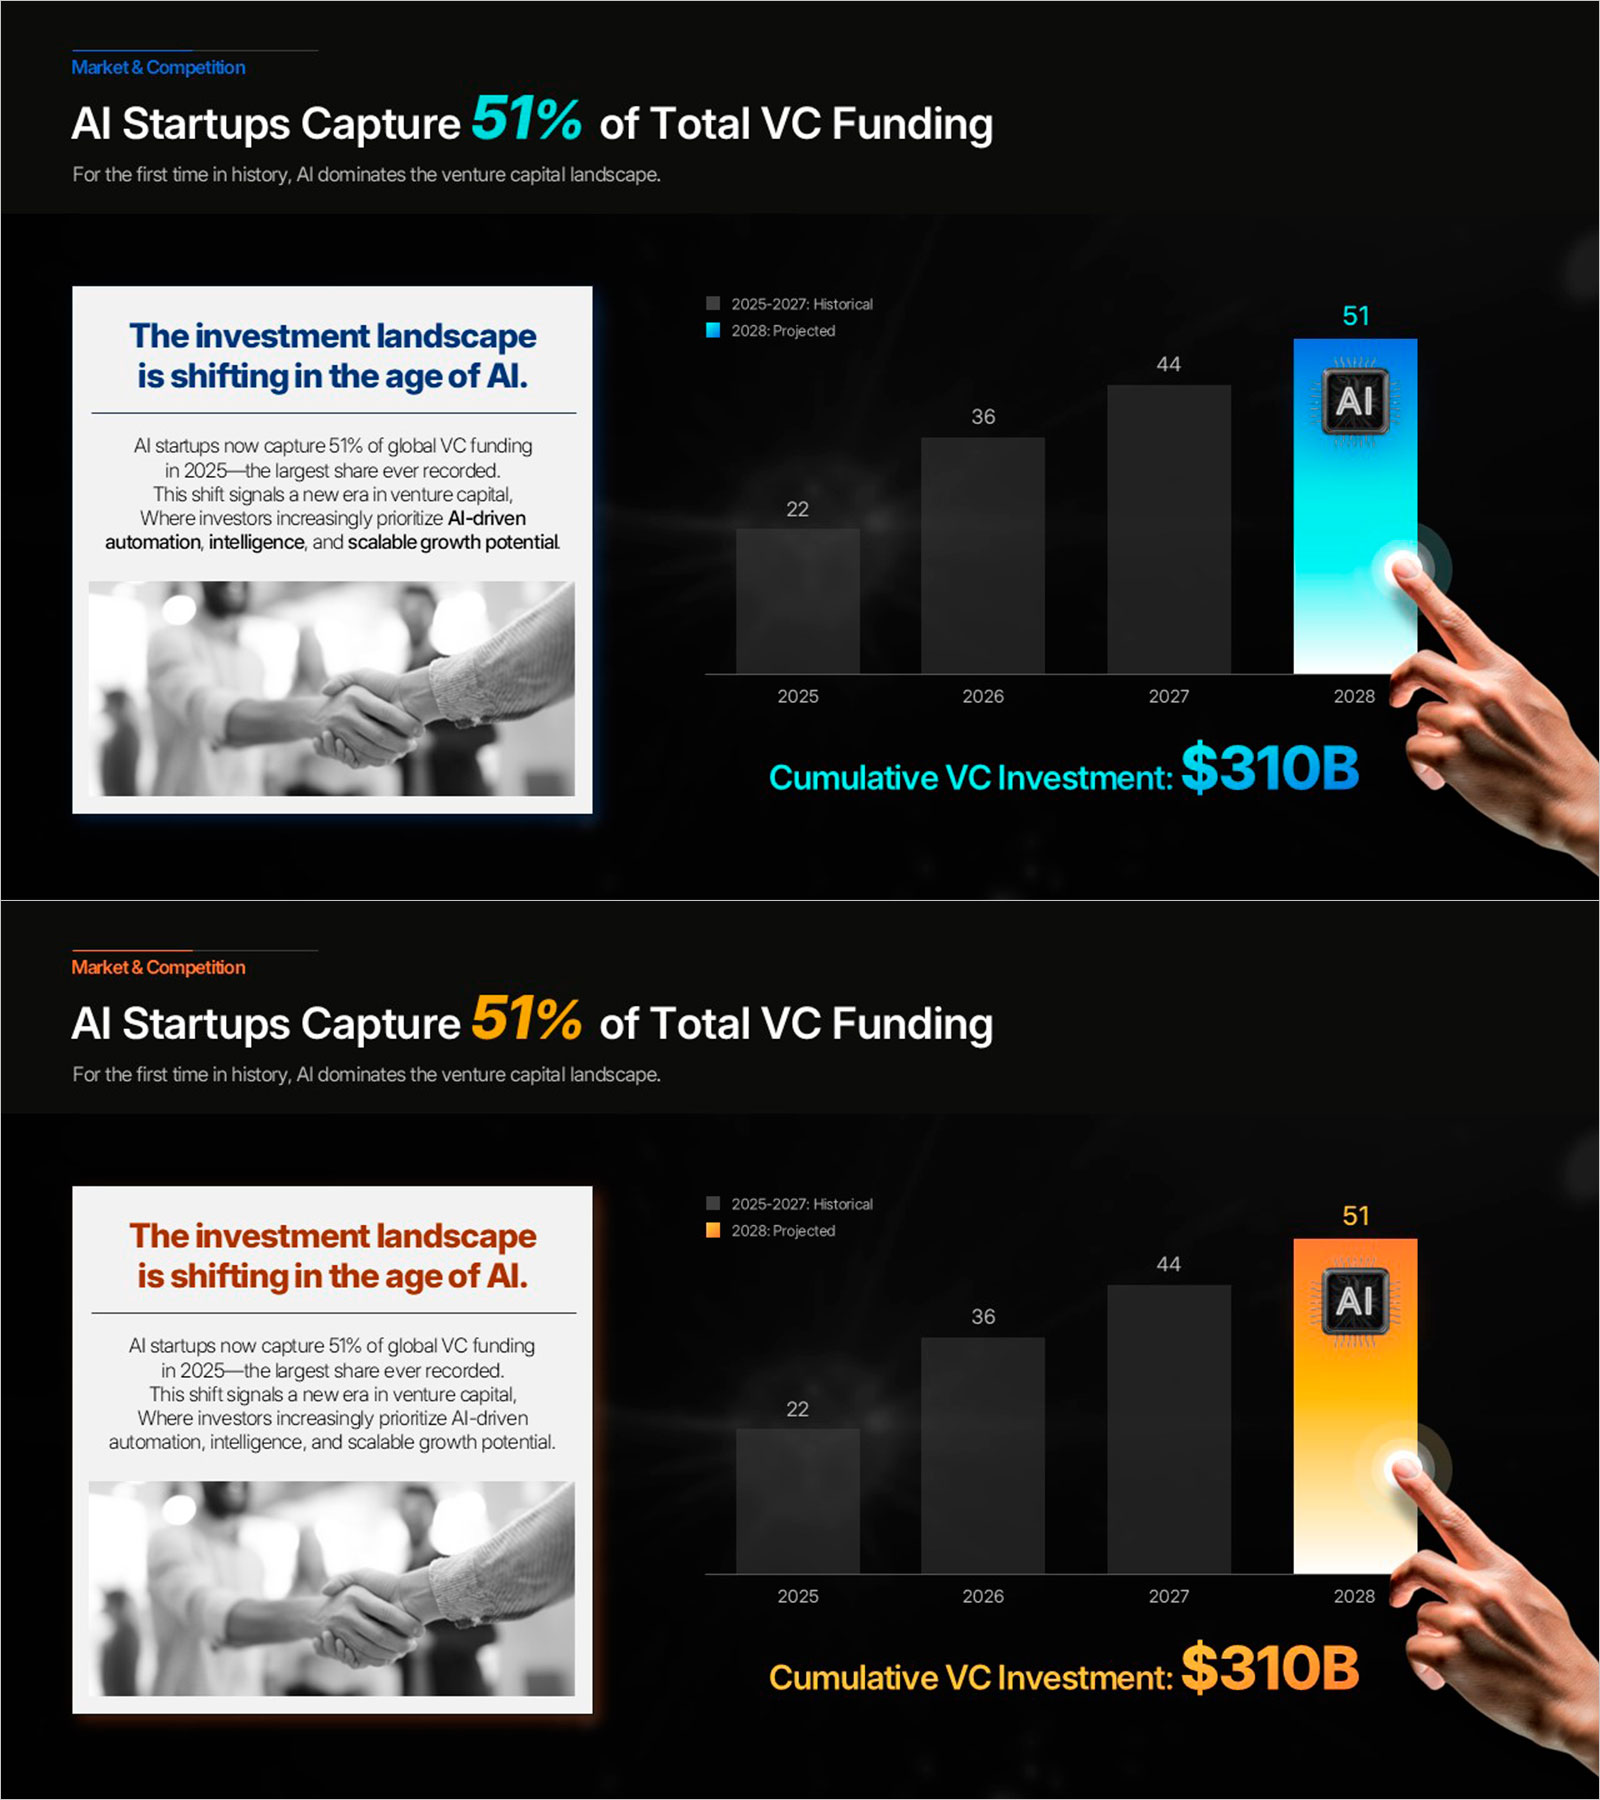
This PowerPoint slide presents AI startup VC market statistics for an investor pitch deck's Market & Competition section. The left panel features a bold text card with headline, body text, and a photo. The right panel shows a four-bar vertical chart (2025: 22, 2026: 36, 2027: 44, 2028: 51 projected) with a $310B cumulative KPI highlight. Two color themes: dark navy with teal accents and dark charcoal with orange accents. Replace chart data and text in the PPTX for any AI market analysis slide.
Usage Points
-
Main Usage
Visualize AI startup VC market growth and 51% funding share data on one slide for the Market & Competition section of an investor pitch deck or market analysis presentation.
-
How to Use
Update the bar chart values and year labels with your own data. Replace the left text card headline, body text, and photo. Select teal-blue or orange color theme.
-
Recommended For
Recommended for AI investment firms, fintech startups, and VC funds presenting AI market growth data, funding share statistics, and cumulative investment figures to investors.
-
Slide Structure
Single 16:9 slide. Section label, headline, and subtext. Left text card: bold headline, body text, photo. Right four-bar vertical chart with $310B KPI. Teal and orange themes.
Related Products
-

Basic Vertical Bar Chart Slide – Market Status Analysis
#Market and Competitor Analysis #Financial Plans and Performance #Graph
-

Vertical Bar Column Chart (Orange & Green) – Visualizing Sales Performance
#Market and Competitor Analysis #Financial Plans and Performance #Graph
-

Simple & Modern Wide PowerPoint Vertical Bar Chart
#Market and Competitor Analysis #Financial Plans and Performance #Graph
-

Column Chart for PowerPoint – Visualization of Market Analysis and Performance
#Market and Competitor Analysis #Financial Plans and Performance #Graph
