Orange Hexagon Presentation Template Area Chart
RJ0200038_24
- Last Update 04/08/2025
- File Size 0.8MB
- # of Slides 2
- File Format PPTX
- Slide Ratio 16:9
- Color
Keywords
- #Content-Based Slides
- #Design-Based Slides
- #Business Strategy
- #Market and Competitor Analysis
- #Graph
- #Other
- #Market Analysis
- #Other
- #Area Chart
- #Project Progress
- #16:9
- #area chart PowerPoint
- #area graph presentation slide
- #stacked area chart template
- #multi-series data visualization
- #business progress chart
- #data trend PowerPoint slide download
About the Product
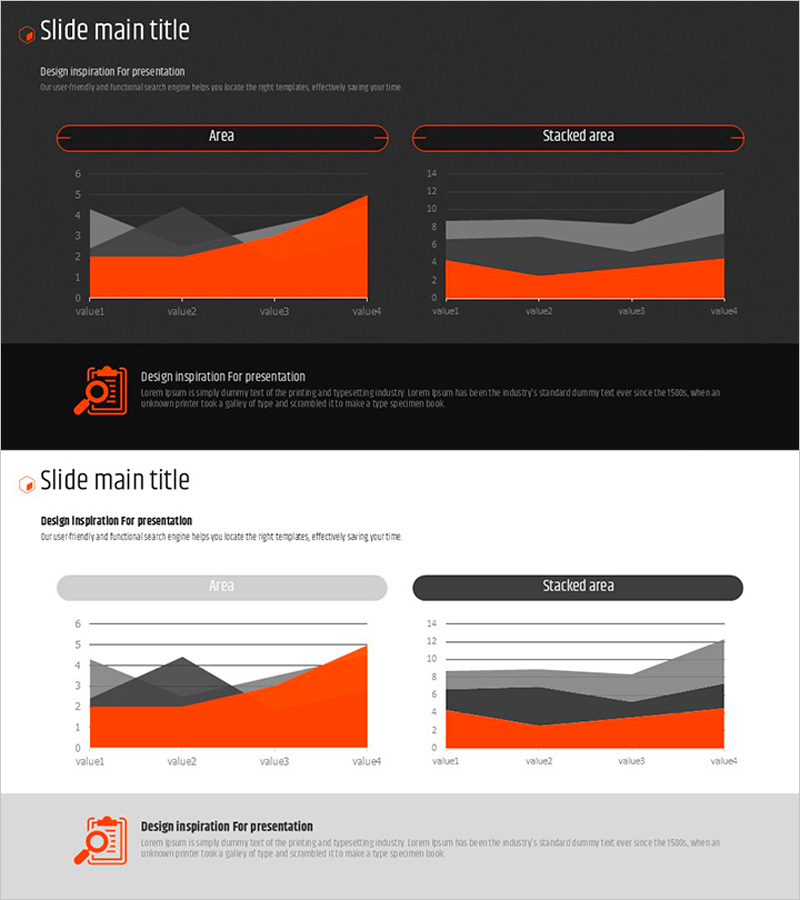
A professional area chart PowerPoint slide designed to visualize business progress and multi-series data trends over time. Features three data series in orange, gray, and black colors that clearly show cumulative changes and comparative patterns. Two layout options are provided: standard area chart and stacked area chart, allowing flexible data representation based on your analysis needs. Optimized for 16:9 widescreen format with 2 slides ready for immediate use in presentations. All colors, values, and labels are fully editable to match your specific data.
Usage Points
-
Main Usage
Visualizes cumulative changes or comparative trends of multiple data series over time. Ideal for displaying business progress, revenue trends, market share evolution, resource allocation, and any scenario requiring simultaneous representation of three or more data categories.
-
How to Use
Insert into performance analysis, business status reports, and financial overview sections of your presentation. Slide 1 displays a standard area chart; Slide 2 shows a stacked area chart. Choose the layout that best represents your data structure. Edit legend labels, axis values, and data points to reflect your actual figures.
-
Recommended For
Executive reports, business plan presentations, quarterly performance reviews, marketing analysis, and financial status updates. Recommended for executives, planners, analysts, and finance professionals who need to communicate multi-dimensional data trends clearly and professionally.
-
Slide Structure
Slide 1: Standard area chart with three series (orange, gray, black) showing individual data trends. Slide 2: Stacked area chart with same color series showing cumulative totals. Both include chart title, legend, X-axis labels (value1–value4), Y-axis scale (0–6 or 0–14). 16:9 widescreen layout.
Related Products
-

Gradient Theme Area Diagram – Market and Competitor Analysis
#Market and Competitor Analysis #Diagram #Graph
-

Abstract Pattern Area Chart Template – Distinctive Data Visualization
#Market and Competitor Analysis #Graph #Other
-

Modern Blue Presentation Area Chart - Optimized for Market Analysis
#Market and Competitor Analysis #Graph #Other
-

Office Supplies Theme Area Graph – Market Analysis and Competitor Comparison
#Market and Competitor Analysis #Graph #Other
