Simple Car Donut Chart for Product Showcase – Stylish Design and Statement Elements
RJ0200057_23
- Last Update 04/14/2025
- File Size 0.4MB
- # of Slides 2
- File Format PPTX
- Slide Ratio 16:9
- Color
Keywords
- #Content-Based Slides
- #Design-Based Slides
- #Product/Service Introduction
- #Graph
- #Differentiation Strategy for Products/Services
- #Development Status
- #Circles
- #Doughnut Chart
- #16:9
- #donut chart PowerPoint slide
- #pie chart presentation template
- #automotive icon diagram
- #product showcase chart
- #ratio visualization slide
About the Product
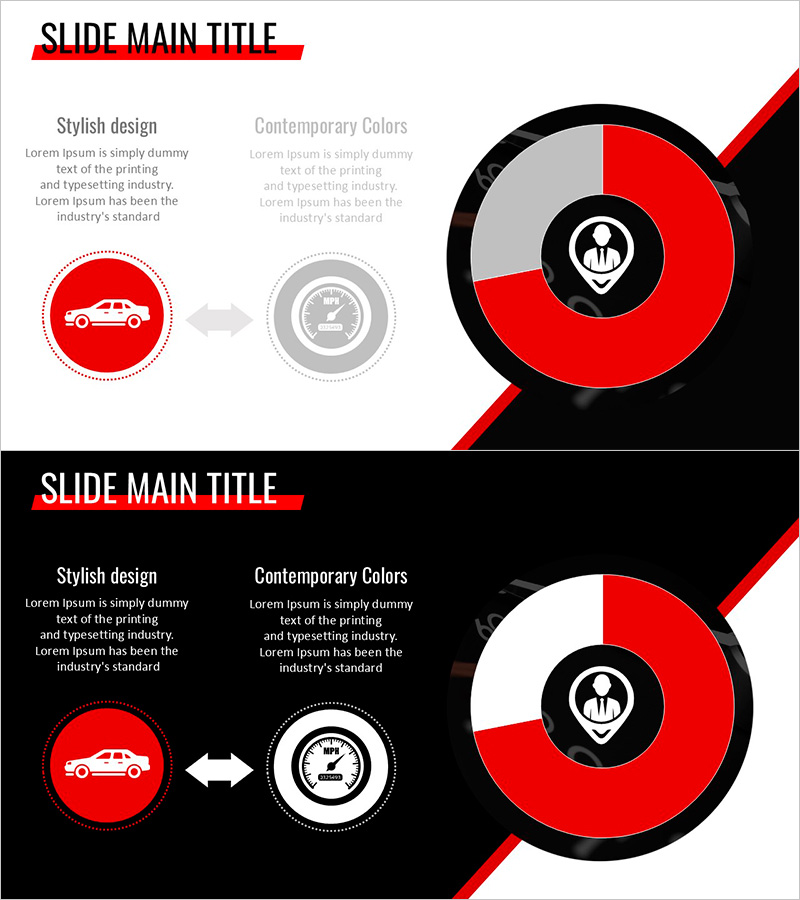
A PowerPoint slide set combining automotive motif with donut chart visualization. The two-tone red and black color scheme effectively presents product features and competitive differentiation, with car and gauge icons positioned at the chart center for intuitive data communication. The 2-slide set includes both light and dark background versions, allowing flexible adaptation to various presentation environments. Ideal for automotive, transportation, logistics, and manufacturing product showcases, sales pitches, and strategic planning presentations.
Usage Points
-
Main Usage
Visualizes product features and competitive differentiation using a donut chart format. The automotive and gauge icons at the center reflect industry context, while the 2-segment ratio data is presented intuitively. Use in product marketing presentations, planning meetings, and sales pitches to emphasize key messages.
-
How to Use
Deploy the light background slide in standard conference rooms and classrooms; use the dark background version in dimly lit auditoriums or online presentations. Input numerical values and percentages into each donut segment, then add product characteristics and competitive advantages in the text areas. Icons and colors are pre-designed for immediate editing and use.
-
Recommended For
Recommended for automotive, transportation, logistics, manufacturing, and machinery industry product presentations. Marketing, sales, and planning teams use it to express 2-item ratio comparisons such as product comparison, market share, and customer satisfaction. Enhances data credibility in executive briefings and investor presentations.
-
Slide Structure
2-slide composition: light background (white top, red-black angled right side) + dark background (black base, red-black angled right side). Each slide features left text area (title and 2-level description) + center automotive icon + right donut chart (2-segment, red-gray or red-white). Gauge icon positioned at chart center.
Related Products
-

Slide Highlighting Contemporary Colors and Design – Practical and Stylish
#Product/Service Introduction #Graph #Differentiation Strategy for Products/Services
-

Development Status Donut Graph – Market Share Visualization
#Product/Service Introduction #Market and Competitor Analysis #Diagram
-

Visualizing Business Development Status with Donut Chart Slide
#Product/Service Introduction #Business Introduction #Graph
-

Port Transport Data & Comparison Chart – Optimized for Market and Competitor Analysis
#Product/Service Introduction #Market and Competitor Analysis #Graph
