Slide Highlighting Contemporary Colors and Design – Practical and Stylish
RJ0700021_13
- Last Update 07/28/2025
- File Size 2.1MB
- # of Slides 2
- File Format PPTX
- Slide Ratio 16:9
- Color
Keywords
- #Content-Based Slides
- #Design-Based Slides
- #Product/Service Introduction
- #Graph
- #Differentiation Strategy for Products/Services
- #Development Status
- #Circles
- #Doughnut Chart
- #16:9
- #donut chart PowerPoint slide
- #pie chart template download
- #data visualization presentation
- #ratio chart PPT
- #multi-layer data slide template
About the Product
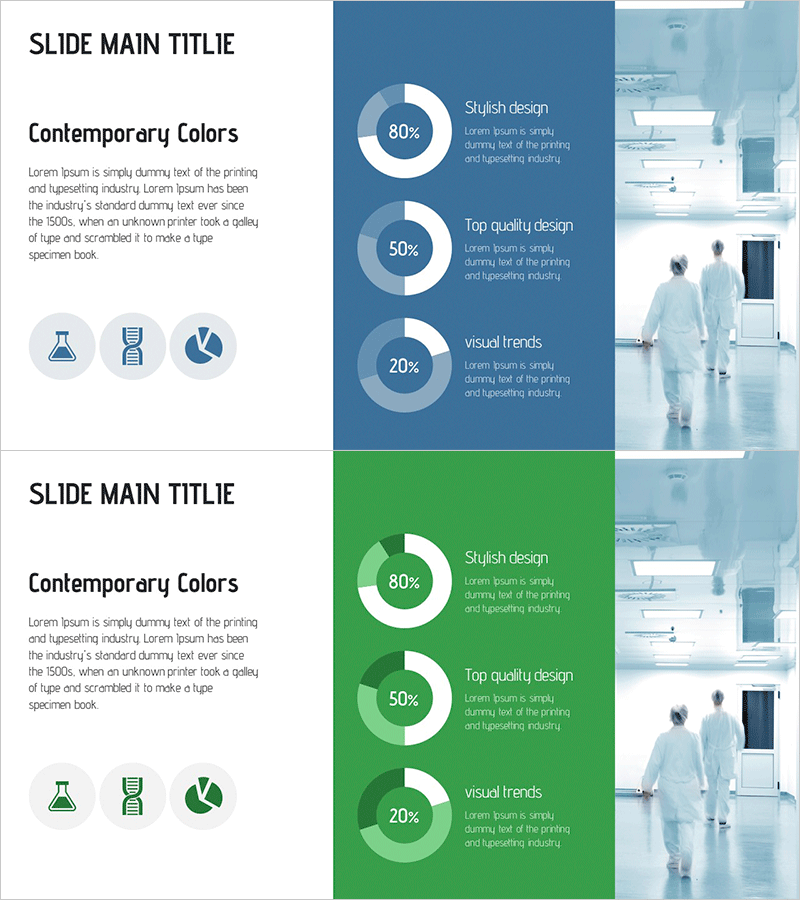
A 2-slide PowerPoint template featuring contemporary donut charts with blue and green color schemes. Each slide displays three vertically stacked donut charts with transparent layering effects, creating clear visual hierarchy for multi-level data representation. The balanced layout combines text and image areas on the right, enhancing presentation credibility. Ideal for healthcare analytics, scientific research, technology performance metrics, marketing ROI analysis, financial composition ratios, and customer satisfaction surveys. Ready to customize with your own data and labels.
Usage Points
-
Main Usage
Visualize multi-level data ratios intuitively using stacked donut charts. Three vertically arranged charts enable simultaneous comparison of composition percentages across multiple categories, while white center areas are optimized for inserting key metrics or labels.
-
How to Use
Apply to marketing performance analysis, financial composition breakdown, customer satisfaction surveys, market share distribution, product sales mix, quarterly results, and investor presentations. Use blue slides for technology, finance, and healthcare topics; green slides for sustainability, growth, and environmental themes.
-
Recommended For
Marketing managers, financial analysts, data scientists, healthcare researchers, executives preparing board reports. Suitable for quarterly performance reviews, investor pitches, internal meetings, academic presentations, and annual reports.
-
Slide Structure
2-slide set with split layout: left text area (title and description) and right image area. Center features 3 vertically stacked donut charts with sample ratios (80%, 50%, 20%). White center rings accommodate custom text, percentages, or labels for easy data customization.
Related Products
-

Simple Car Donut Chart for Product Showcase – Stylish Design and Statement Elements
#Product/Service Introduction #Graph #Differentiation Strategy for Products/Services
-

Business Development Status Analysis Graph – Key Insight Visualization
#Product/Service Introduction #Market and Competitor Analysis #Graph
-

Blue Green Development Status Circular Graph – Market Analysis Through Data Visualization
#Product/Service Introduction #Market and Competitor Analysis #Graph
-

Visualizing Business Development Status with Donut Chart Slide
#Product/Service Introduction #Business Introduction #Graph
