Simple Car Wide Presentation Table
RJ0200057_17
- Last Update 04/14/2025
- File Size 0.2MB
- # of Slides 2
- File Format PPTX
- Slide Ratio 16:9
- Color
Keywords
- #Content-Based Slides
- #Design-Based Slides
- #Marketing Plan and Strategy
- #Financial Plans and Performance
- #Diagram
- #Marketing Objectives
- #Key Financial Indicators
- #Table
- #Standard Table
- #16:9
- #car comparison table PowerPoint
- #three-column table slide template
- #automotive presentation slide
- #car marketing PPT
- #widescreen table slide download
About the Product
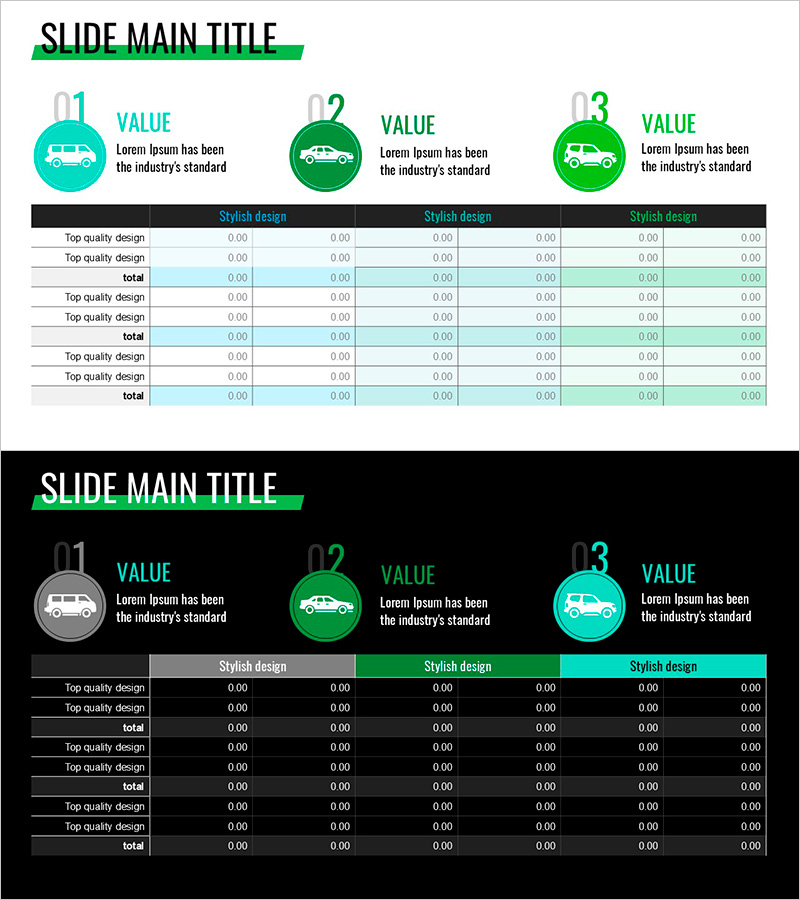
A three-column comparison table PowerPoint slide designed for automotive industry presentations. Provided in two design variations—light background and dark background—each column features a car icon with value descriptions for visual comparison. Created in 16:9 widescreen format optimized for modern presentation environments, this slide deck is ready to use immediately for marketing strategies, product comparisons, performance analysis, and other business scenarios requiring data-driven automotive presentations.
Usage Points
-
Main Usage
This table slide is optimized for comparing three automotive products, services, or performance metrics side-by-side. Each column is distinguished by a car icon and color coding (cyan, green, lime), making it ideal for marketing strategies, competitive analysis, model feature comparisons, and performance benchmarking in automotive presentations.
-
How to Use
Enter your comparison topic in the title area at the top of the slide. Replace the 'VALUE' text in each column with your item names. Input actual data or descriptive text in the numeric fields (0.00) of the bottom table. Select either the light or dark background version based on your presentation context and color scheme preferences.
-
Recommended For
Recommended for automotive manufacturers, dealerships, and rental companies' marketing teams; automotive industry analysts preparing comparison reports; sales teams requiring product comparison presentations; and planners who need to visualize car performance, pricing, and option comparisons in professional settings.
-
Slide Structure
Two-slide set: one light background version and one dark background version. Each slide features a title area at the top, three circular car icons, three color-coded columns (cyan, green, lime), and a 3×6 data table at the bottom for detailed information entry.
Related Products
-

Diagram for Visualizing Financial Plans – Grey Brown Design
#Financial Plans and Performance #Diagram #Capital Requirements
-

Table Chart of Point Frames – Profit and Loss Statement and Key Financial Metrics
#Financial Plans and Performance #Diagram #Income Statement
-

Green Brown Statistics Table – Financial Performance Analysis
#Financial Plans and Performance #Diagram #Balance Sheet
-

Business Income Statement – Visualizing Financial Performance
#Financial Plans and Performance #Diagram #Income Statement
