Rainbow Presentation Template Chart and Icons – Enhance Your Financial Planning
RJ0200022_8
- Last Update 04/03/2025
- File Size 3.9MB
- # of Slides 2
- File Format PPTX
- Slide Ratio 16:9
- Color
Keywords
- #Content-Based Slides
- #Design-Based Slides
- #Financial Plans and Performance
- #Diagram
- #Capital Requirements
- #Key Financial Indicators
- #Table
- #Standard Table
- #16:9
- #comparison table PowerPoint slide
- #5-item data table template
- #icon chart slide
- #financial data visualization
- #table diagram PowerPoint template download
About the Product
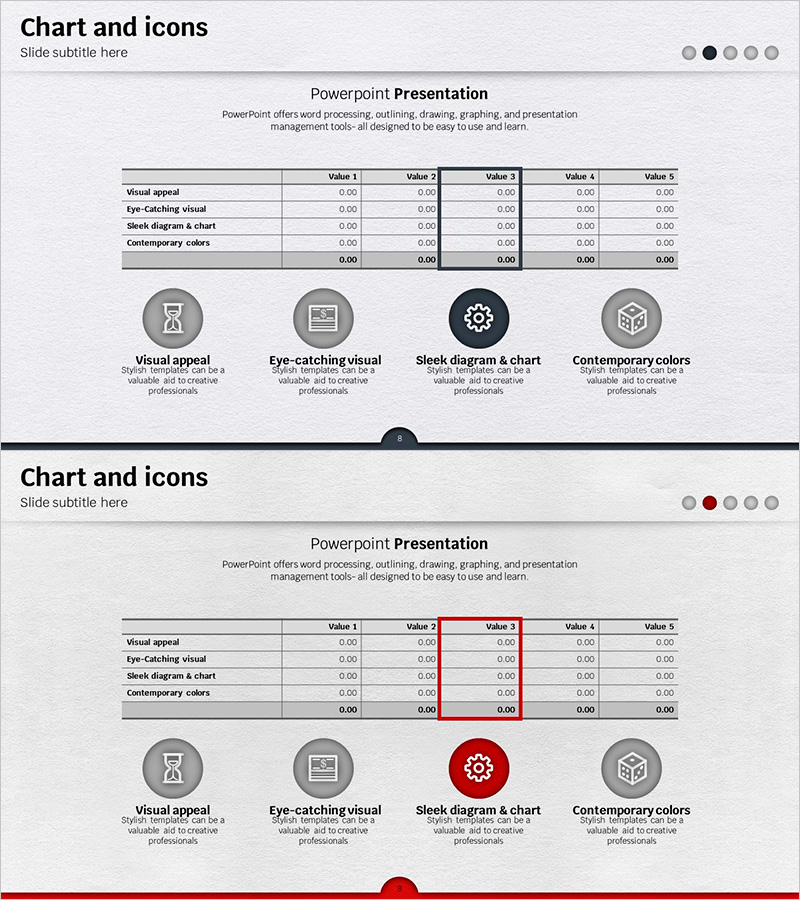
A PowerPoint slide combining a 5-column data table with 4 icon elements for visual comparison and analysis. Available in three color variants—gray, black, and red—each slide features a structured table with 5 data columns and 4 labeled rows. The icons represent key categories: visual appeal, eye-catching visuals, diagram design, and contemporary colors. Ideal for financial planning, performance analysis, and comparative evaluations in business presentations. Fully editable PPTX format with 2 slides in 16:9 widescreen ratio.
Usage Points
-
Main Usage
Displays 5 data items in a horizontal table format for quick side-by-side comparison. The 4 icons at the top represent key evaluation categories, making the slide suitable for presenting metrics, features, or performance indicators across multiple dimensions.
-
How to Use
Insert your data into the 5 columns and 4 rows of the table. Select the color variant (gray, black, or red) that matches your presentation theme. Edit the icon labels and row headers to reflect your specific comparison categories, then customize the data values.
-
Recommended For
Finance teams, executives, marketing professionals, consultants, and data analysts presenting comparative analysis. Suitable for quarterly reports, investment proposals, product comparisons, performance evaluations, and business plan presentations.
-
Slide Structure
Each slide contains a title area at the top, a central 5-column × 4-row data table with labeled rows (Visual appeal, Eye-catching visual, Sleek diagram & chart, Contemporary colors), and 4 icon elements with labels at the bottom. Both slides share identical structure with color variations only. Fully editable cells for custom data entry.
Related Products
-

Patient Examination Item Table Slide – Efficient Data Management
#Financial Plans and Performance #Diagram #Capital Requirements
-

3 Main Tables and Summary Messages for Financial Insights
#Financial Plans and Performance #Diagram #Text Box
-

Hotpot Table Chart – Clearly Present Financial Performance
#Financial Plans and Performance #Diagram #Capital Requirements
-

Highlight Table Chart – Clear Visualization of Financial Performance
#Financial Plans and Performance #Diagram #Capital Requirements
