Triangle Pattern Template Table – Visualizing Business Strategy
RJ0200016_14
- Last Update 04/01/2025
- File Size 6.2MB
- # of Slides 2
- File Format PPTX
- Slide Ratio 16:9
- Color
Keywords
- #Content-Based Slides
- #Design-Based Slides
- #Business Vision and Strategy
- #Financial Plans and Performance
- #Diagram
- #Business Strategy
- #Key Financial Indicators
- #Table
- #Standard Table
- #16:9
- #comparison table PowerPoint slide
- #data table template
- #4-item comparison chart
- #business strategy table
- #financial planning slide
- #hexagon icon table PowerPoint
About the Product
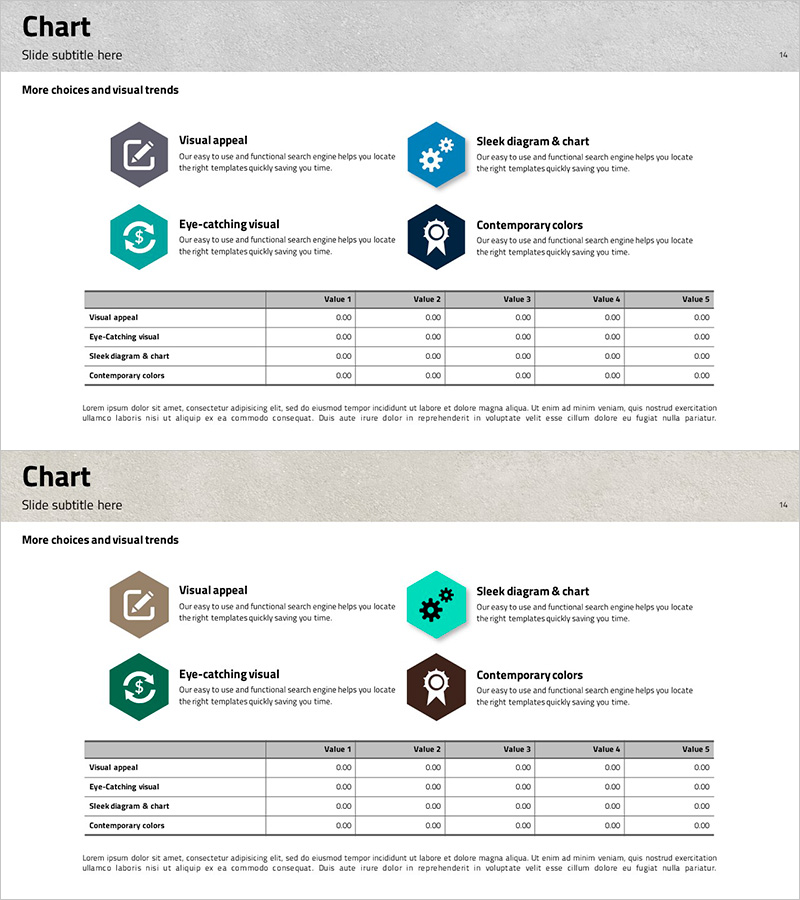
A 4-item comparison table PowerPoint slide designed for business strategy and financial planning presentations. Hexagon icons in gray and blue tones visually distinguish each category, while 5 data columns enable side-by-side comparison of metrics, KPIs, and performance indicators. Optimized for 16:9 widescreen format with 2-slide set, this template is ready to use in executive reports and strategic planning decks. Clear row labels and data cells ensure efficient information delivery and quick comprehension of comparative data.
Usage Points
-
Main Usage
Compare and analyze 4 categories across 5 data columns for business strategy, financial metrics, performance targets, and departmental goals. Hexagon icons clearly distinguish each row category, while consistent cell layout enhances data readability and supports side-by-side metric comparison.
-
How to Use
Use in executive presentations, business planning meetings, financial analysis reports, and strategic review sessions to display comparative data across multiple dimensions. Simply input your actual figures into each cell for immediate use; colors and icons can be customized to match corporate branding guidelines.
-
Recommended For
CFOs and finance managers, strategic planning teams, business development professionals, executive presenters, consulting firms, and investment analysts who need to organize quantitative data systematically and communicate comparative analysis results clearly.
-
Slide Structure
2-slide set with each slide featuring a 4-row × 5-column table structure. Left side displays hexagon icons in gray, blue, teal, and dark blue to visually categorize each row. Table includes descriptive text area below for additional context and supporting information.
Related Products
-

Table of Major Financial Indicators – Optimized for Performance Analysis
#Financial Plans and Performance #Diagram #Budget
-

Eco-friendly Business Budget Table Chart - Simple and Functional Design
#Financial Plans and Performance #Diagram #Budget
-

Financial Indicator Text Table – Financial Performance Analysis
#Financial Plans and Performance #Diagram #Budget
-

Business Table Charts – Intuitively Presenting Financial Performance
#Financial Plans and Performance #Diagram #Projected Return on Investment (ROI)
