Simple Car Wide Presentation Donut Chart - Perfect Template for Technical Introductions
RJ0200057_16
- Last Update 04/14/2025
- File Size 2.8MB
- # of Slides 2
- File Format PPTX
- Slide Ratio 16:9
- Color
Keywords
- #Content-Based Slides
- #Design-Based Slides
- #Product/Service Introduction
- #Business Introduction
- #Graph
- #Development Status
- #Technological Status
- #16:9
- #technical status donut chart PowerPoint
- #technical metrics presentation slide
- #3-metric comparison chart
- #how to visualize technical performance in PowerPoint
- #technical presentation slides
About the Product
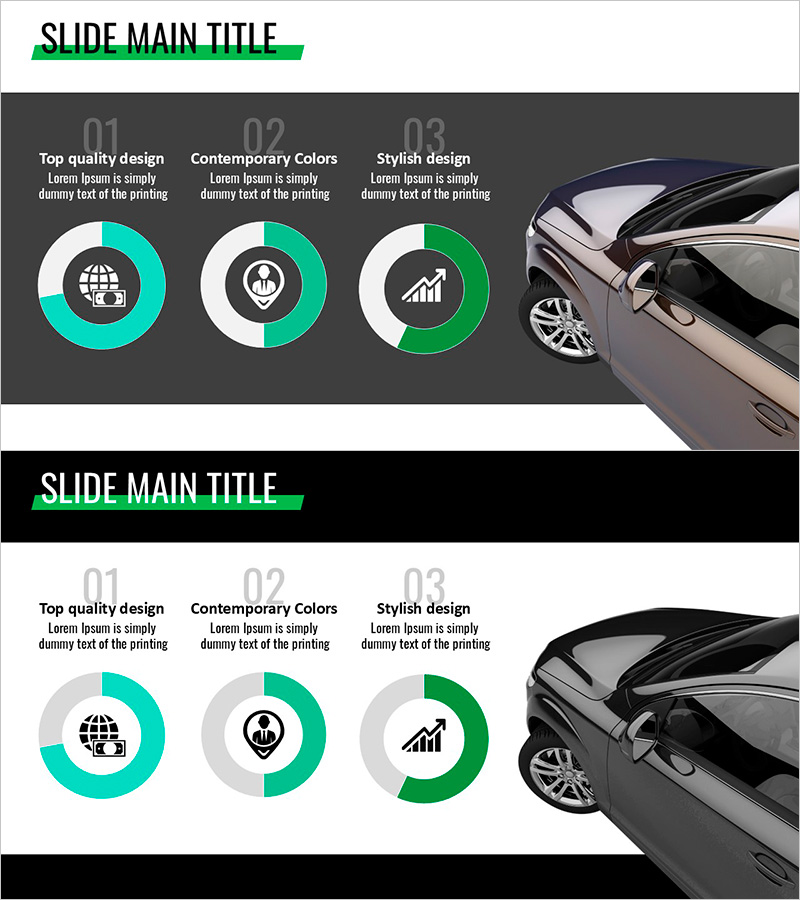
A PowerPoint slide featuring three donut charts to visualize technical status and key performance indicators. Set against a dark gray background, the turquoise, white, and green donut charts effectively compare technical capabilities, market positioning, and growth rates at a glance. Each chart includes dedicated text areas below for detailed explanations, making it ideal for technical presentations and performance reports. The 2-slide set allows flexible representation of multiple technical metrics, while the 16:9 widescreen format ensures compatibility with modern presentation environments.
Usage Points
-
Main Usage
Present technical status by comparing three key metrics (technical capability, market positioning, growth rate) simultaneously using donut charts, enhancing audience comprehension. Strengthens data credibility in technical introductions, strategy presentations, and performance reports.
-
How to Use
Replace the center icons (globe, person, growth) with symbols matching your technical focus. Input actual data values and labels into the charts and text areas. Use the two slides to present additional metrics or detailed technical analysis. Customize colors and text to align with your company branding.
-
Recommended For
Technology managers, development team leads, technical strategy officers, innovation directors, technical report writers, seminar speakers, and investment presentation coordinators who need to demonstrate technical capabilities and status with objective data visualization.
-
Slide Structure
2-slide set with dark gray background featuring three donut charts (turquoise, white, green) per slide, three text input areas below each chart, and vehicle imagery on the right. Each chart represents an independent technical metric with dedicated explanation space, creating a balanced data-driven layout.
Related Products
-

Financial Management Analysis Status Graph
#Product/Service Introduction #Business Introduction #Graph
-

Business Plan Presentation Template Pie Diagram – Effective Project Introduction
#Product/Service Introduction #Business Introduction #Graph
-

Idea Development Analysis Chart – Data-Driven Innovation
#Product/Service Introduction #Business Introduction #Diagram
-

Global Business Development Status Graph – Vision for Expansion
#Product/Service Introduction #Business Introduction #Graph
